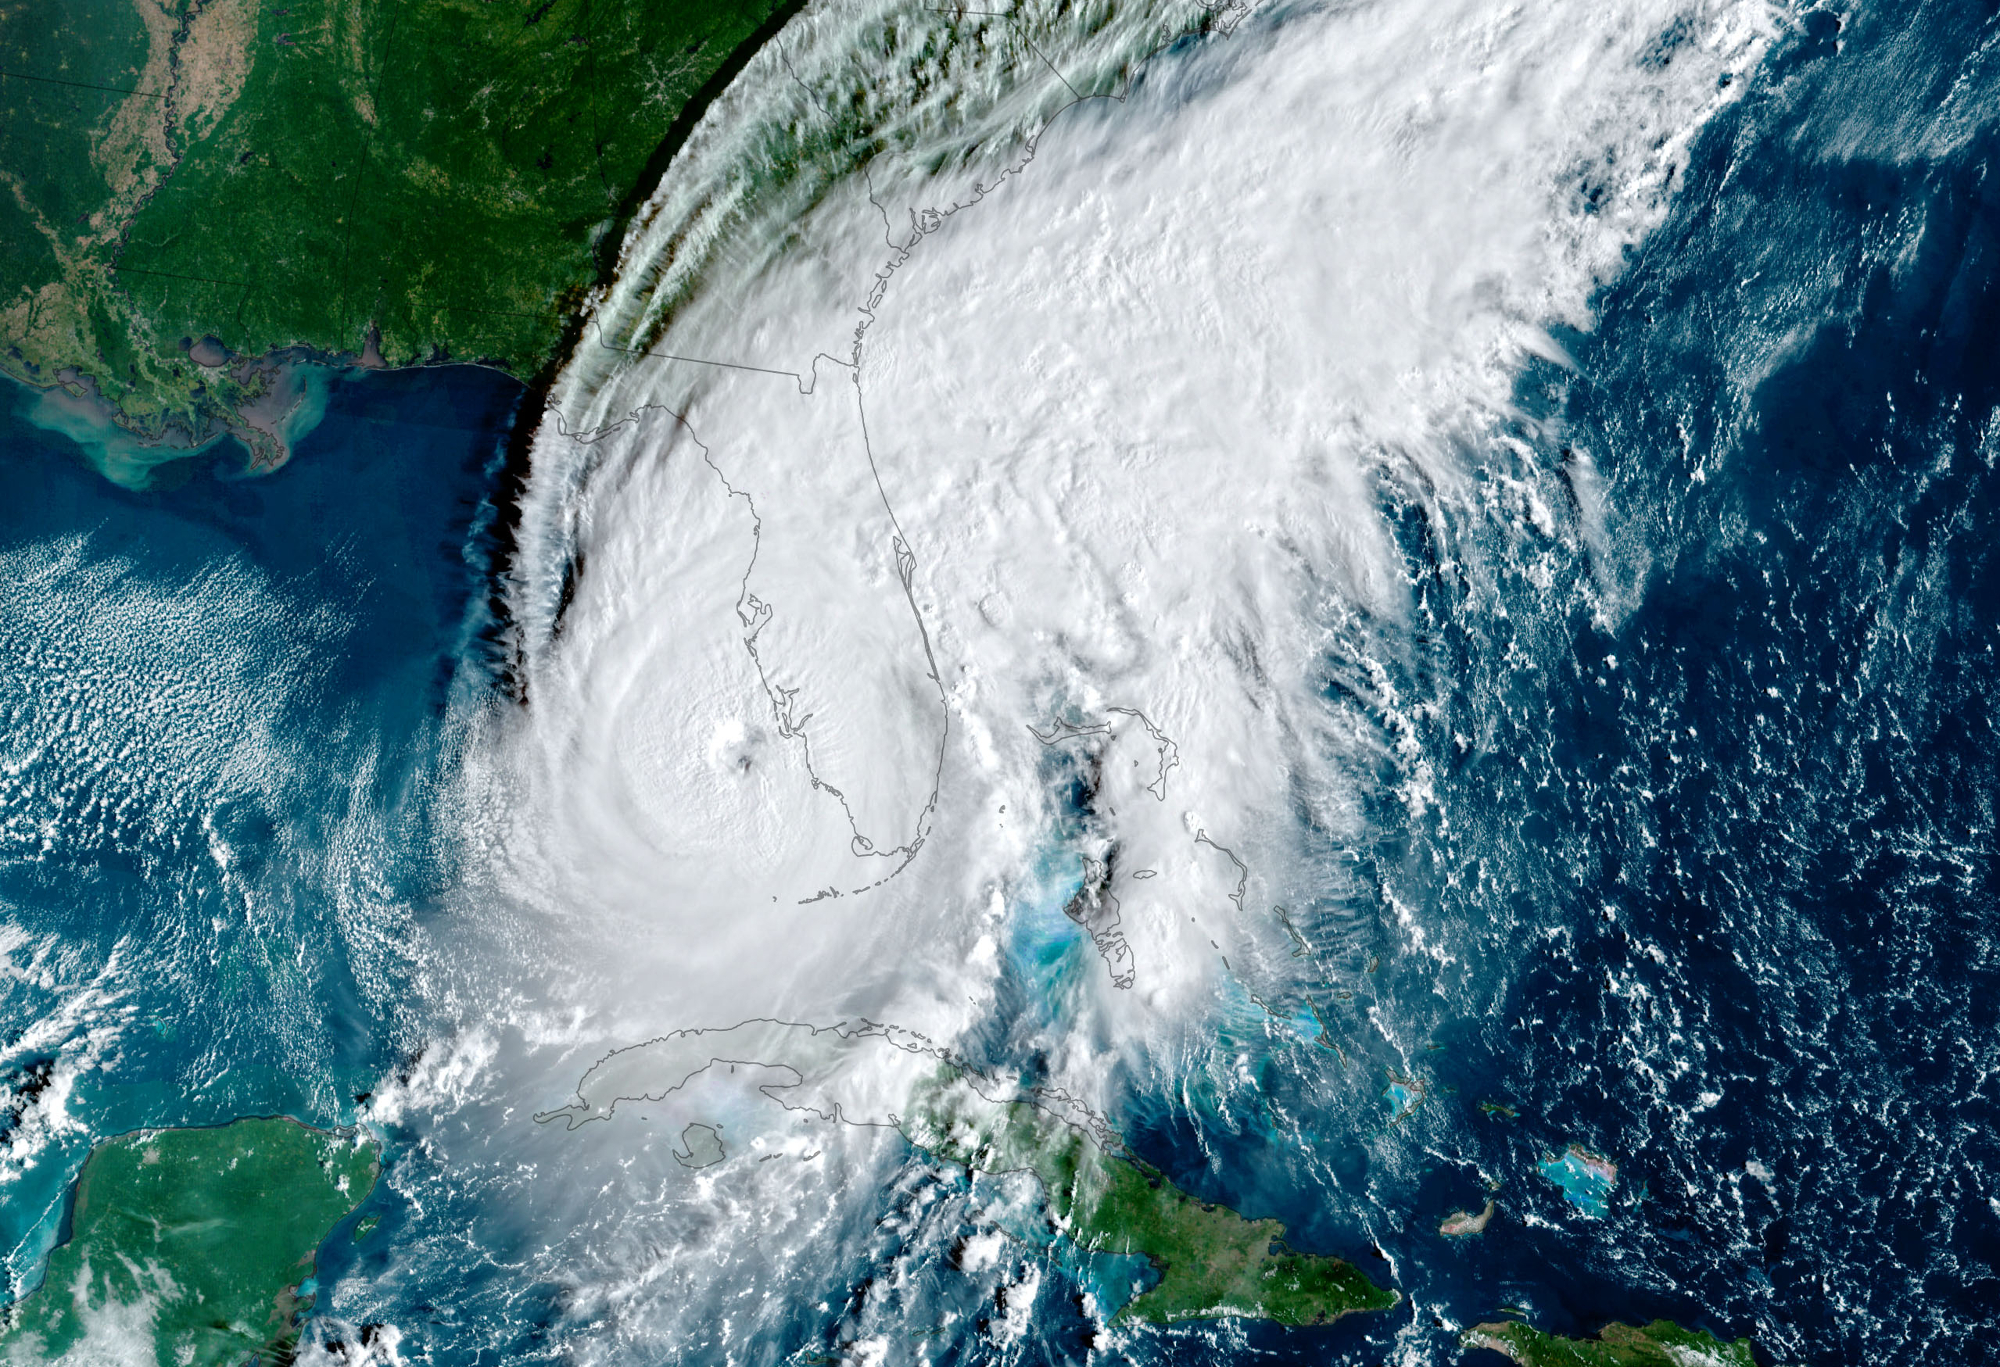
Title image: Hurricane Ian, September 28, 2022 Credit: NASA
What can we expect this year?
[Editor’s Note: This article provides an in-depth look at the science behind the 2024 Hurricane Season Forecast presented at the CAC “Hurricane Day” event at USF Sarasota-Manatee April 4th, 2024. The event featured presentations by Bob Bunting, CAC CEO; Ric Kearbey CAC Senior Scientist; Guillermo Franco, Managing Director, Guy Carpenter Reinsurance; and Tom Lewis, President and Chief Operating Officer, Tidal Basin Group.]
It’s that time of the year when hurricanes are drifting back into our consciousness again. Here in Florida, we may be in dread mode as there has been a lot of publicity about how warm the oceans are in the Hurricane Development Region and the fact at a strong El Niño is falling apart in the Pacific and the chances of a La Niña during peak hurricane season from July through October is rising.
There is no doubt Florida and the entire Gulf Coast have taken a beating since 2017 with 8 major hurricane strikes in 7 years. Along the Gulf Coast, these storms have killed hundreds and caused at least $425,000,000,000 in damage and untold misery.
Even if you are personally not dealing with direct impacts, we are all paying with higher insurance premiums that are at nosebleed levels, particularly in Florida where we are experiencing some of the highest premiums in the nation. Hurricanes enhanced by climate change are taking a toll. That is why the Climate Adaptation Center makes its annual hurricane forecast tailored to Florida’s specific issues. With this information you and our communities should be able to prepare and to anticipate and prevent some of the worst impacts. Prevention of loss can be expensive, but one study says that for every $1 spent in adaptation we save $11 in disaster response. That is a good strategy!
In this article I discuss the main drivers I consider to make my Hurricane Season Forecast each year. As we learn more as scientists, I do change how each is used. This process, while disciplined, also involves a good bit of intuition based on decades of forecasting extreme weather events including hurricanes, researching them and even flying into them! I do know colleagues who don’t have that touch but have amazing technical skills. Even in today’s computer-centric digital world, experience-based intuition can be an important discriminator.
This year I am focused on this set of drivers for the forecast:
- warm water
- low wind shear
- abundant mid-level atmospheric moisture
- minimal Saharan dust
- African easterly waves
Let’s get to it!
Warm Water
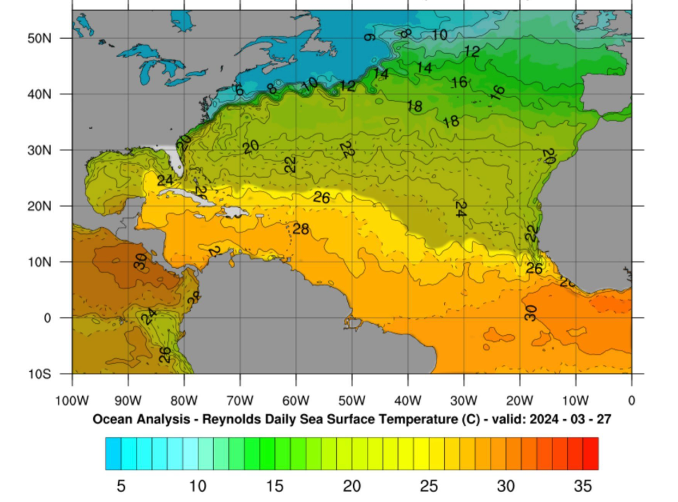
Credit: National Hurricane Center (NCEP/NOAA)
The chart above is what the Atlantic Sea Surface Temperature (SST) pattern looked like on March 27. These temperatures are in °C and the 26°C contour is the demarcation line between water that is warm enough to support major hurricane formation and temperatures that are not. One can easily see that much of the southern Atlantic, Caribbean and even part of the Gulf of Mexico are already super warm. These are record-setting warm temperatures for this early in the season.
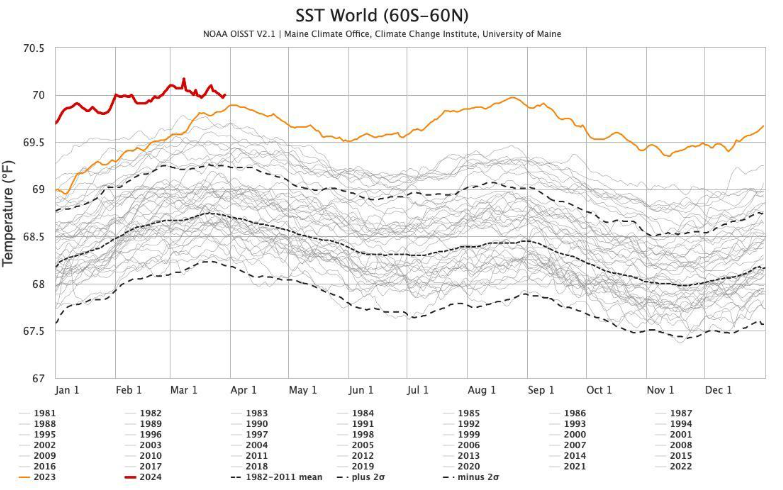
Daily global average sea surface temperatures as of March 2024
In Fact, SSTs are at historic record levels for the planet as a whole. The red line at the top is this year so far and the yellow line shows 2023 which was the record before this year!
Low Wind Shear
The influence of wind shear on hurricane development is easiest to explain using the image below.
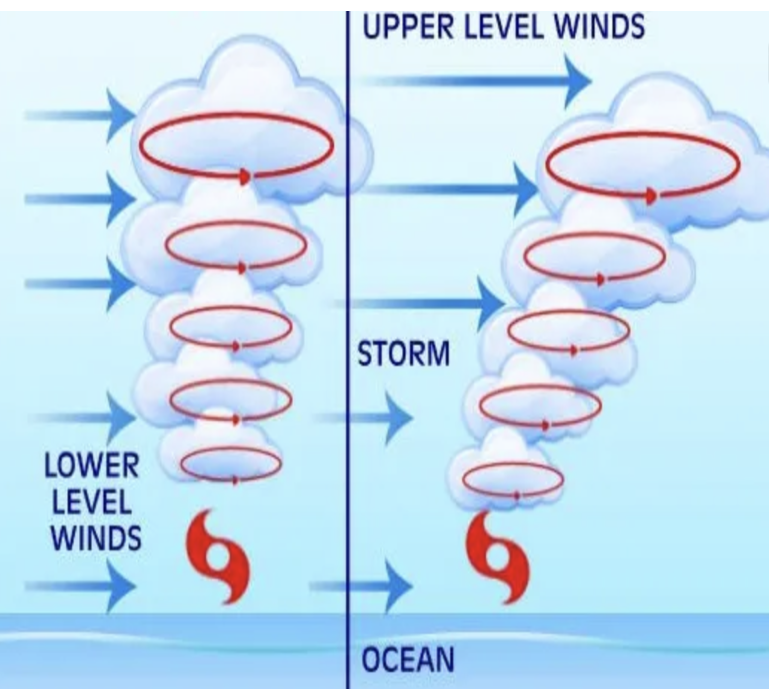
When there is little wind shear, the clouds surrounding the eye of a tropical storm can stack up. When this happens the storm can easily intensify, and with warm SSTs that can happen very quickly!
When there is significant wind shear, the clouds above the storm center blow over as one can see in the right half of the graphic above. This structure means hurricanes can’t stack up and they usually can’t intensify very quickly, if at all.
Understanding this simple concept is important for the next step, where I look at conditions that give strong support to higher or lower wind shear. The cycle between El Niño and La Niña, called the El Niño Southern Oscillation (ENSO), is a key predictor.
When El Niño is occurring, the wind shear in the Atlantic Hurricane Development Area which includes the Gulf of Mexico, Caribbean Sea and southern portions of the Atlantic, is higher than normal. In general, El Niño years have fewer hurricanes and strong hurricanes.
In 2023 for example, while there were 20 named storms, there were 7 hurricanes and 3 major hurricanes. It was an active season overall because of the very warm SSTs but the El Niño helped limit hurricanes and major hurricanes to a normal level. The CAC predicted 7 hurricanes and 2 or 3 major hurricanes in the 2023 annual hurricane season forecast!
But when La Niña occurs during hurricane season, wind shear is low and the potential number of storms, hurricanes and major hurricanes is enhanced.
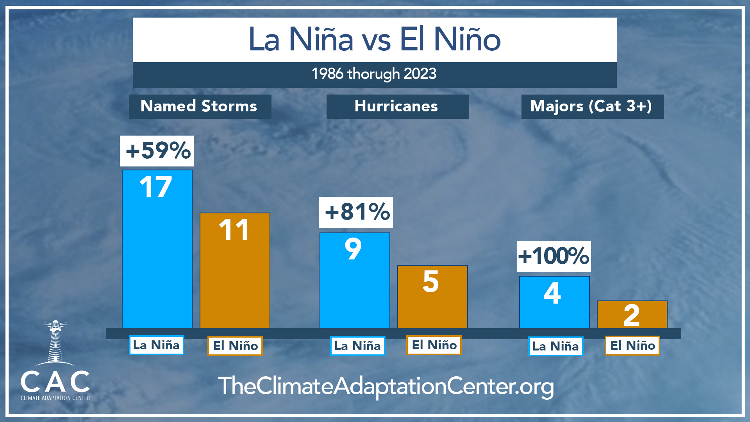
Take a minute to really look at the chart above. La Niña is a big player in active hurricane seasons!
What about 2024? Will we have a La Niña during peak hurricane season? I am sorry to say the answer is most likely YES.
Here is the latest ENSO forecast from the NOAA Climate Prediction Center (CPC).
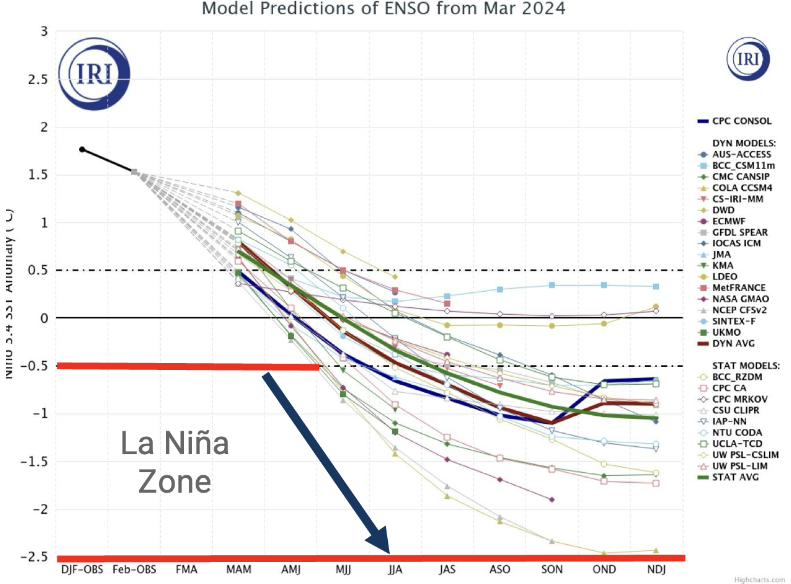 The chart shows temperature anomalies in ºC on the vertical axis and 3-month periods on the bottom. For example, MJJ on the bottom axis is May, June, July. At the moment, the El Niño we have had since last fall is rapidly dying. The spaghetti lines are the forecasts for SSTs in the El Niño zone of the Pacific Ocean. Each line is the temperature forecast from a climate model for El Niño or La Niña conditions in future months. The dark blue heavy line is the official forecast from the NOAA CPC.
Once the SST anomalies become -0.5°C colder than the average (the ‘0ºC’ horizontal line right in the middle of the chart), then La Niña is underway.
Unfortunately, La Niña looks like it will hit at the beginning of the usual hurricane season (June through November) and it will be in force right through the end of the year. The probability of a La Niña being established by hurricane season is now 80%.
In light of our discussion so far, we now have two big predictors indicating a very active hurricane season for us! Warm water is rocket fuel for hurricanes and weak wind shear allows for rapidly forming and intense hurricanes.
Abundant Moisture
The remaining predictors are all related to the moisture level in the middle atmosphere where clouds form. The more mid-level moisture the better the conditions for tropical storm and hurricane formation.
We have clues right now from the various model suites or ensembles. At the moment, all of them are showing abundant moisture in the Hurricane Formation Areas from June through September and possibly into November. The following charts from the National Center for Environmental Prediction’s Climate Forecast System (CFS) show examples of the forecast precipitation anomaly for May, July, September and October 2024.
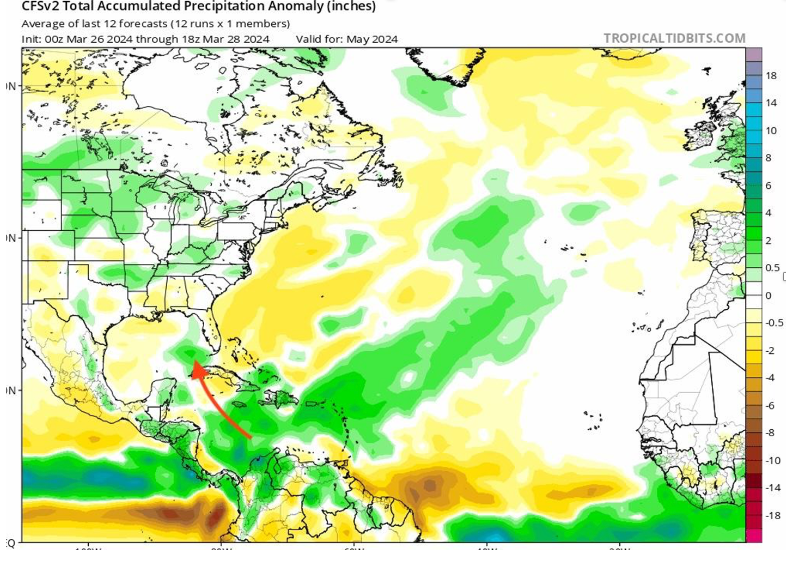
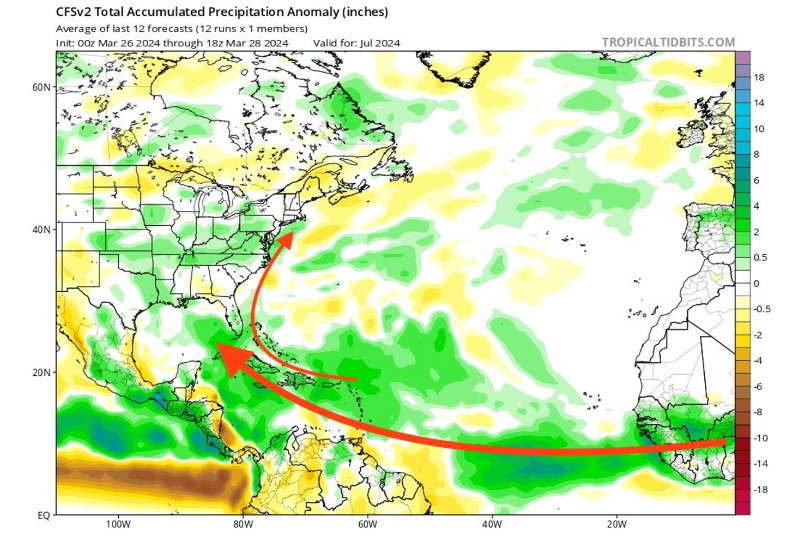
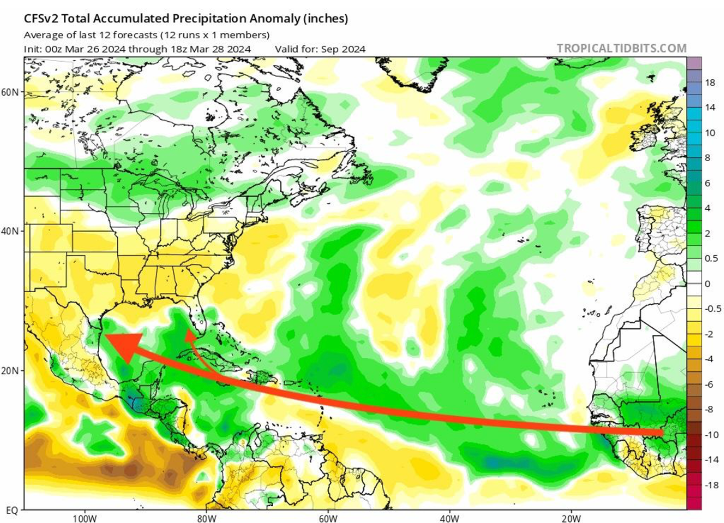
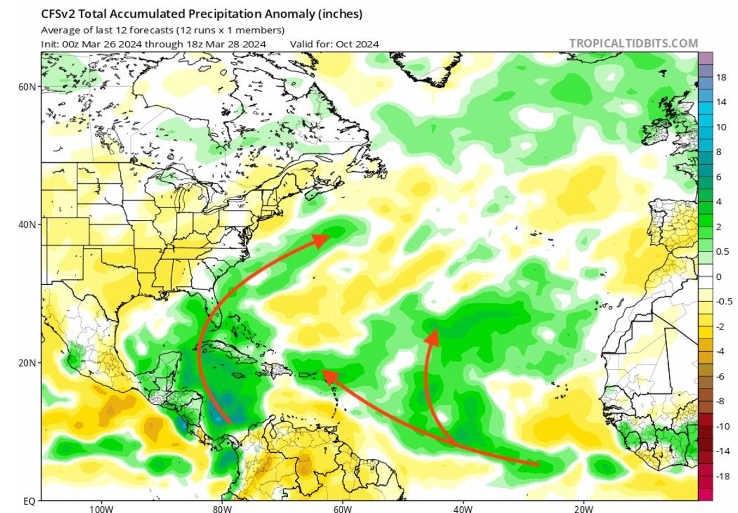
The red arrows are CAC overlays that suggest how storms could track during the months shown. The main point is that abundant moisture is forecast right through hurricane season.
I showed the forecast for May although technically May is not yet considered part of the tropical storm season. But this year it would not surprise me at all if the tropical storm season starts early and ends late.
Saharan Dust
All the ingredients are lined up for a big hurricane season in 2024. What could happen to decrease the threat? One of the most difficult things to determine is how much dust blows out of the Sahara Desert into the Atlantic. In past years, even last year, this dry air keeps storms subdued for weeks. If that happens again that would help tamp down the season a bit. I am not counting on that right now.
African Easterly Waves
These are generally enhanced shower clusters that move east across the southern part of central Africa, emerging in the Atlantic Ocean near the Cape Verde islands. During La Niña, these waves can be somewhat less frequent. When that happens, hurricane formation off the coast of Africa tends to diminish, while formation further west near the West Indies, the Caribbean and the Gulf of Mexico tends to increase. That is what I expect to happen in this hurricane season.
The CAC 2024 Hurricane Season Forecast
Without further explanation here is the season forecast.
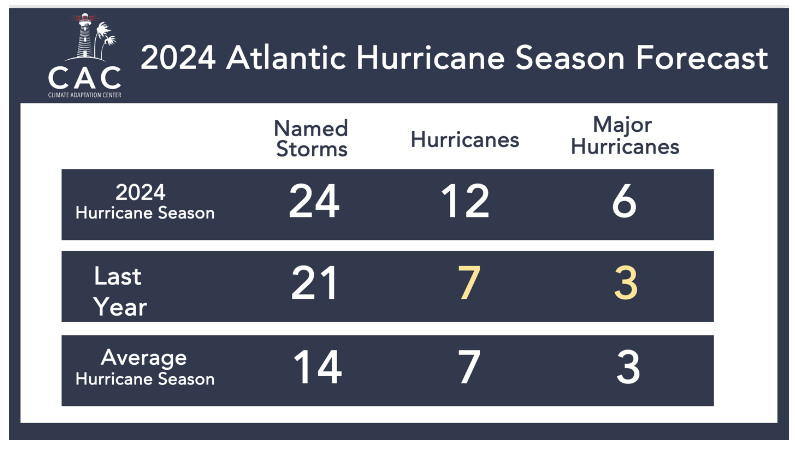
The 2023 Hurricane Season was the 4th most active in history. That was during an El Niño and despite weeks of heavy dust from the Sahara desert blowing across the Hurricane Formation Area. This season will likely feature even warmer SSTs, a La Niña and abundant moisture—all factors that suggest a very active season.
Back in 2020 we experienced a record 30 named storms in one season. It is just early April in 2024 and things are still somewhat in a state of flux. Nonetheless, in my opinion the threat is there and a record season could happen. Even if we stay in a very active zone, this is the season to be vigilant.
The CAC will update this forecast if conditions warrant, so stay tuned.
Things To Do Now
Be sure to check our website and subscribe to our email newsletter. We will do our best to keep you ahead of the storms.
What can you do right now?
- Check your insurance coverage
- Be sure you have all your important papers readily to hand, so you can take them with you in case of evacuations.
- Don’t stay in low-lying areas if a storm is coming. Even minor storms are creating much greater flood impact now because of sea level rise.
- Know your evacuation routes. What is their elevation? Will they be drivable if a big storm develops and approaches without much warning?
- Where will you go? Make a plan for that now.
- Where will you park your car to ensure it doesn’t get damaged in flooding?
- KNOW YOUR ELEVATION!
- DON’T LET INERTIA BE YOUR ENEMY!
Watch our website for future updates as conditions warrant and sign up for our free Newsletter by hitting the ‘Subscribe” button below. If you do, you will receive our timely Hurricane Updates when a storm threatens our area!