Title image: Jakobshavn Glacier, Greenland
Closing in on an AMOC Collapse?
Editor’s note: This post is a continuation of “Ocean Currents and Climate Change: Part 1“
The AMOC is Slowing Down
The AMOC has been relatively stable for the last 8,000 years. However, that hasn’t always been the case. Paleoclimate research shows that changes in the AMOC played a key role in some of the strongest and most rapid climate shifts during the past 2.6 million years. Understanding the processes that affected historical AMOC behavior is the key to predicting its behavior under today’s rapidly warming climate.
In the past, the AMOC repeatedly became unstable, in some cases resulting in its total collapse. Paleoclimate studies suggest the most recent collapse occurred about 12,000 years ago, near the end of the last ice age, when the climate was warming and large volumes of melting ice flooded into the North Atlantic, bringing the AMOC to a halt. The figure below gives a vivid indication of the amount of ice that melted at the end of the last ice age, much of it ending up in the North Atlantic.
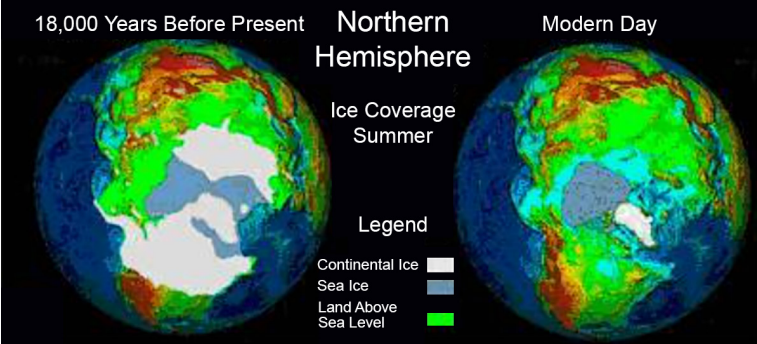
Credit: NOAA/NCEI
The resulting collapse of the AMOC cut off the northward flow of warm water to the northern Atlantic, triggering a regional cold period called the Younger Dryas. The Younger Dryas returned parts of Europe and North America to near ice age conditions for 1,300 years.
As the global climate warmed, ending the Younger Dryas event, the AMOC revived, remaining relatively stable until the last 100 to 200 years, when it began to weaken. Although direct measurements of the AMOC weakening have only been possible since the launch of the RAPID project in 2004, other indirect data sources reveal AMOC behavior as far back as 1600 years.
One of the most prominent indirect indicators of a weakening AMOC emerged in recent decades as an area of the subpolar Atlantic south of Greenland that has defied global warming — the infamous “cold blob” (also called the “warming hole”.) It is clearly shown in the figure below as the only area to cool over the last century while climate change warmed the rest of the world.
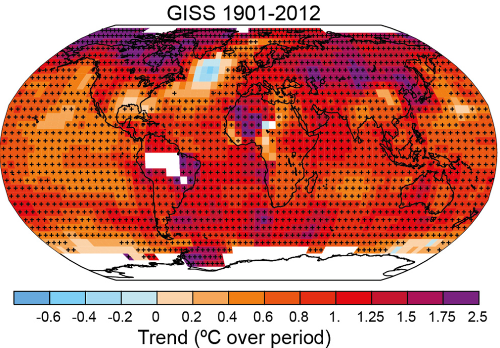
The observed rise in global average surface temperatures from 1901 to 2012, based on NASA Goddard Institute for Space Studies temperature records. Credit: IPCC AR5
Analysis of sea surface temperature trends and other indicators show that the cooler water in the cold blob is likely a result of reduced northward transport of warm water by the weakening AMOC. Another indirect indicator of a weaker AMOC is the development of an exceptionally warm area along the northeast coast of the US, caused by the Gulf Stream shifting closer to the coast as the AMOC weakens.
On a longer timescale, analysis of ocean floor sediment cores by David Thornalley and colleagues provide evidence that the AMOC has been weaker in the last 150 years than at any time in the preceding 1500 years.
The figure below combines time series data from Thornalley et al with data from five other studies, including measurements from the RAPID project starting in 2004 (the yellow line.) Despite their disparate sources and time spans, the curves are broadly consistent — showing a long-term AMOC slowdown that is accelerating.
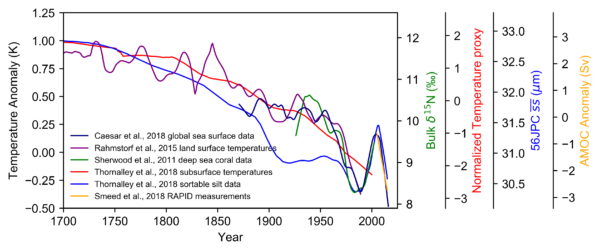
Credit: Rahmstorf (2018)
Climate Change Is Affecting the AMOC
Climate change is slowing the AMOC circulation in two ways that reduce the density of near-surface water in the subarctic, thus slowing the deep water formation that drives the AMOC:
- warming water at the ocean’s surface
- reducing surface water salinity by diluting it with fresh water
The fact that the Arctic is warming three times faster than the rest of the planet is well known. The most prominent result is the increasing loss of sea ice and the exposure of more open water in the Arctic Ocean. According to NOAA, summertime average Arctic sea surface temperatures have increased by nearly 1ºF per decade.
The rapid warming of the Arctic will intensify the hydrologic cycle in the region throughout this century, increasing Arctic precipitation by up to 60% in coming decades. The wetter Arctic is driven by increased evaporation as a result of more open water in the ocean; rising air temperatures that allow the atmosphere to hold more moisture; and increased poleward moisture transport from lower latitudes. Observations indicate the Arctic is transitioning from snow- to rain-dominated precipitation in the summer and fall. The result of these changes is freshwater injection into the AMOC through rainfall on the ocean and runoff from surrounding land.
When it comes to freshwater injection into the AMOC, the gorilla in the room is the Greenland ice cap. As a result of global warming, the ice cap is pumping fresh water into the ocean through surface melting and glacier calving. A recent study determined that between 2003 and 2018 Greenland lost 264 billion tonnes of ice per year—an average rate of about 30 million tonnes an hour!
Approaching the AMOC Tipping Point
A tipping point is a critical threshold beyond which a system (like the AMOC) reorganizes, often abruptly and/or irreversibly. The Intergovernmental Panel on Climate Change (IPCC) defines climate tipping points in more detail: “We define abrupt climate change as a large-scale change in the climate system that takes place over a few decades or less, persists (or is anticipated to persist) for at least a few decades, and causes substantial disruptions in human and natural systems.” IPCC 5th Assessment Report (AR5).
The AMOC is prone to sudden change at a tipping point because it is a “self-reinforcing” system. It works because it transports upper level salty water to the subarctic Atlantic Ocean and that salty water increases the density of water in that area, causing the water to sink and reinforce the deep water flow southward, which eventually results in the transport of more salty water northward, and so on. As climate change increases fresh water flows into the North Atlantic, the circulation slows, less salty water is transported northward and the North Atlantic becomes even less salty, weakening the circulation further. Once freshwater inflows slow the circulation enough, the self-reinforcing system starts to work to progressively weaken the circulation, the system reaches a point of no return – the tipping point – and the AMOC system becomes unstable, potentially leading to a total collapse.
The following graph illustrates what happens to the AMOC at its tipping point. Today’s climate puts us at the “Present Climate” point on the upper green line. As the North Atlantic Deep Water flow decreases due to inputs of fresh water, the system enters a “Bistable” state, where the system could be stable in either of two states, a steadily weakening AMOC circulation (the upper green line) or a collapse state of little or no circulation (the lower green line). As the freshwater forcing increases and circulation decreases, the system moves from the Present Climate point toward the tipping point (the “bifurcation point” first proposed by H. Stommel (1961) Instability from further freshwater forcing causes the North Atlantic Deep Water (NADW) “collapse”, falling to a stable state on the lower green line.
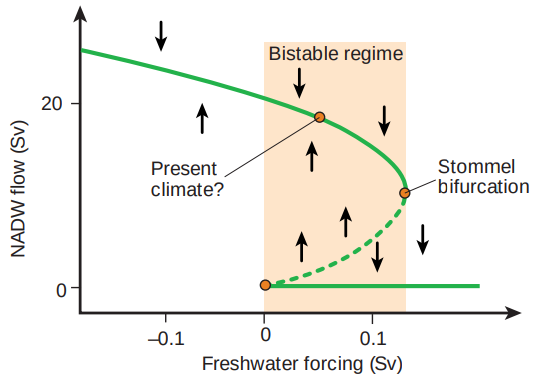 The graph shows NADW and fresh water flows in Sv units. 1 Sv is 1 million cubic meters of water per second.) Credit: Stefan Rahmstorf
Recovery of the AMOC from the stable collapse state requires the freshwater forcing to decrease dramatically (to the red point on the lower green line), at which point the system becomes unstable again and AMOC flow restarts.
AMOC Collapse
The figure below shows the AMOC as it nears collapse. Note that the wind-driven Gulf Stream remains largely intact, although weakened.
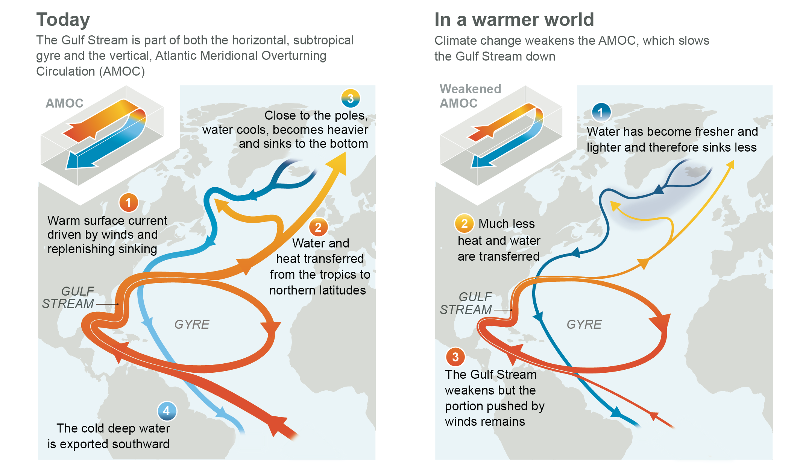
The AMOC as it is today and as it nears collapse in a warmer climate. Credit: IPCC AR6, Working Group 1
Previously, a collapse was thought to be unlikely in this century, requiring considerably higher levels of global warming. However, recent studies published in the last few years suggest that the tipping point may be much closer.
In 2021, Niklas Boers identified early warning signals of collapse in observations of sea surface temperature and salinity across the Atlantic Ocean basin. Boers concluded that “AMOC decline during the last decades is not just a fluctuation related to low-frequency climate variability or a linear response to increasing temperatures. Rather, the presented findings suggest that this decline may be associated with an almost complete loss of stability of the AMOC over the course of the last century, and that the AMOC could be close to a critical transition to its weak circulation.”
In 2023, Ditlevsen and Ditlevsen performed a statistical analysis of sea surface temperatures, comparing trends in the global mean temperature with trends in the Subpolar Gyre region of the Atlantic. In conclusion “[They] predict with high confidence the tipping to happen as soon as mid-century (2025–2095 is a 95% confidence range)”. Many scientists, (perhaps less statistically inclined), disputed the results, although agreeing that a collapse could be closer than previously thought.
In early 2024, in a physics-based study using the latest generation of climate models, René van Westen and colleagues simulated the flow of fresh water until the AMOC circulation reached the tipping point. This was the first time the tipping point has been demonstrated in a state-of-the-art global coupled atmosphere-ocean climate model—unequivocal evidence that the tipping point exists. The results showed that the circulation could fully shut down within a century of hitting the tipping point, and that it’s headed in that direction.
More importantly, van Westen et al identify a physics-based and observable early warning signal (EWS) based on the salinity transport in the Atlantic Ocean at the latitude of the southern edge of Africa. Once we accumulate sufficient data for this EWS, we will be able to predict when the tipping point will be reached. However, when asked to comment on the Ditlevsen study, they commented that “their estimate of the tipping point (2025 to 2095, 95% confidence level) could be accurate.”
The van Westen et al study rapidly became a media sensation, largely driven by the dawning realization of the potential impacts of an AMOC collapse.
The Impact of an AMOC Collapse
The impact of an AMOC collapse would be global, as shown by its interconnection with other tipping elements in the climate system in the figure below.
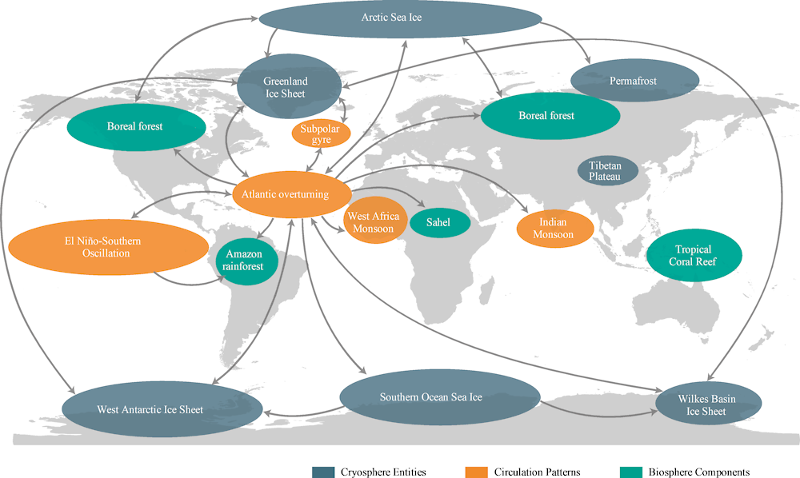
Credit: OECD
Fundamentally, heat transport toward the north Atlantic will be strongly reduced, leading to abrupt climate shifts
Regions that are currently influenced by the Gulf Stream receive much less heat when the circulation stops. This cools North America and Europe. Atmospheric and sea-ice feedbacks will amplify the AMOC-induced changes, resulting in a very strong and rapid cooling of the European continent — predicted to cool 3ºC (over 5ºF) per decade, much faster than current global warming rates of 0.2+ C per decade. Realistically, adaptation to such a rapid change would be impossible.
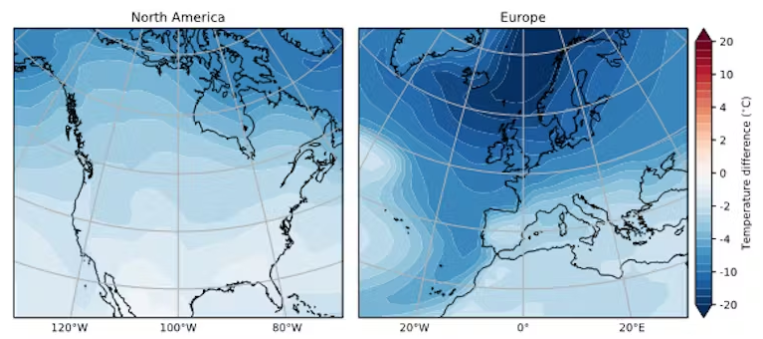 Northern hemisphere temperatures after the AMOC shuts down. Credit: Rene van Westen/The Conversation
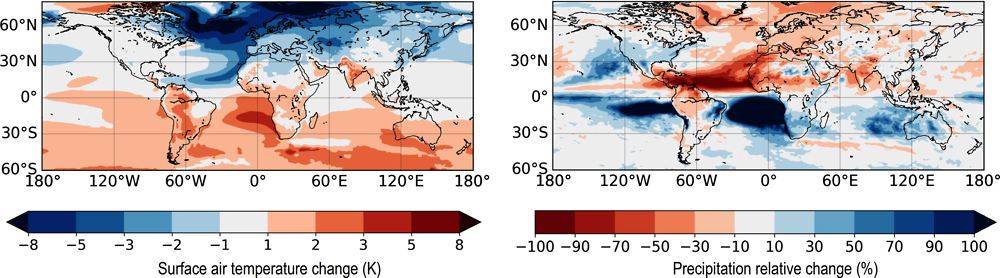
Climate changes as a result of an AMOC collapse after global warming of 2.5ºC. The maps combine the 2.5ºC climate with the changes predicted after an AMOC collapse Credit: OECD
Model-based forecasts agree that a strong dynamic sea-level rise along the Atlantic coast of North America will occur as a result of the reduced AMOC flow.
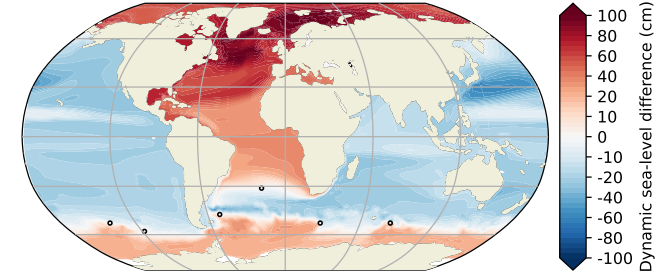
Dynamic rise in sea level is predicted for the east coast of North America, in the absence of a strong AMOC. Note that sea level rise will occur in parallel with the weakening of the AMOC, even before the AMOC collapse. Credit: René van Westen
A collapse of the AMOC would have serious impacts on food security in many regions. An AMOC collapse under warming reduces the growth suitability of three major staple crops – wheat, maize and rice, which together provide over 50% of global calories. Most of the northern hemisphere would become less suitable for growing these staple crops. Europe would be especially affected as it becomes cooler and drier in the absence of the AMOC.
The bottom line is that the risks of an AMOC shutdown increase as global warming continues. In his interview by Carbon Brief a few years ago, Stefan Rahmstorf sums up our situation:
“But, I would say, most people think that to trigger a real shutdown would require substantial global warming – like 3C or 4C. And we could pretty well minimize this risk by limiting the warming to below 2C. So, if we actually take the Paris Agreement seriously, then I would feel relatively relaxed about the risk of a shutdown. But if we continue on the current path and heading for three or more degrees, then this becomes a really serious concern.” Prof. Stefan Rahmstorf, Potsdam University
Unfortunately, Climate Action Tracker predicts that current climate policies worldwide put us squarely on track for 3ºC of warming by 2100, as we rack up year after year of record temperatures and rising CO2 levels.