Title Image: Carbon Click
The Climate after Net Zero
What Would Zero Emissions Look Like?
As we mentioned in Part 1 of this post, carbon dioxide (CO2) is the dominant greenhouse gas, the atmospheric component of the land/atmosphere/ocean “carbon cycle” that circulates carbon between the components of the cycle and the organisms that live in them. Human activities, from burning fossil fuels to clearing land, are rapidly transferring more carbon into the atmosphere as CO2, which is having ripple effects throughout the carbon cycle. Natural processes are able to absorb about half of CO2 emissions. The rest stays in the atmosphere where it can remain for thousands of years.
The most abundant and long-lived of the greenhouse gases, CO2 emissions are the main engine driving climate warming. Because of its longevity, the CO2 we add to the atmosphere accumulates over time, amplifying the greenhouse effect and racheting up the global average surface temperature.
So, what happens if we stop emitting CO2, reaching zero CO2 emissions? Using climate models, we can predict the outcome with considerable confidence.
Basically, we find that warming quickly slows and stabilizes. The global average surface temperature settles at a new baseline where it will remain for hundreds of years. Unfortunately, that new temperature is not the pre-industrial baseline temperature but the higher temperature at which CO2 emissions reached zero.
The following graph illustrates the result if we had been able to instantly change to zero CO2 emissions in 2020. The historical temperature record is shown by the irregular black line. The blue line shows predicted temperatures after CO2 emissions are set to zero in 2020.
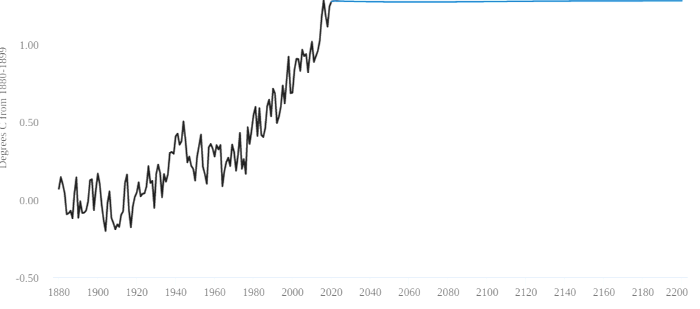
.Future warming after changing to zero CO2 emissions
(adapted from a chart by Carbon Brief)
The situation becomes more complex when we consider reducing CO2 more gradually, and when we consider the other greenhouse gases. We will discuss both situations later, but for now we’ll concentrate on CO2 — the elephant in the room.
The fact that the future temperature stabilizes so readily after CO2 emissions stop is the result of two natural processes cancelling each other out.
The Earth is normally in a state of thermal equilibrium, where the energy from the sun that is retained by the atmosphere’s greenhouse effect is balanced by the energy that escapes into space. The rapid magnification of the greenhouse effect by our production of greenhouse gas emissions is disrupting the balance by retaining more energy than is radiated into space, warming the planet. Over 90% of that excess heat energy is captured by the oceans, which slowly warm. The warming oceans are less able to remove heat from the atmosphere and climate warming results.
Balancing this warming process is the absorption of atmospheric CO2 by the natural “carbon sinks” of the land-based biosphere and the oceans. Half of global CO2 emissions are captured this way. Examples are the intake of CO2 by growing plants, and the absorption of CO2 by the oceans. When CO2 emissions stop, carbon sinks continue to absorb CO2, drawing on the CO2 already in the atmosphere. The CO2 content of the atmosphere declines, the greenhouse effect weakens and the climate cools.
As luck would have it, these opposing processes cancel each other out, and the temperature stabilizes at the level coincident with reaching zero CO2 emissions.
The Transition to Zero CO2 Emissions
The processes that result in the global surface temperature flatlining at the global average when CO2 emissions reach zero are not affected by the starting temperature or the level of CO2 in the atmosphere. The NASA graphic below nicely illustrates the point, with temperatures rapidly stabilizing after CO2 emissions reach zero, regardless of the level of the CO2 in the atmosphere or the average temperature when emissions stop.
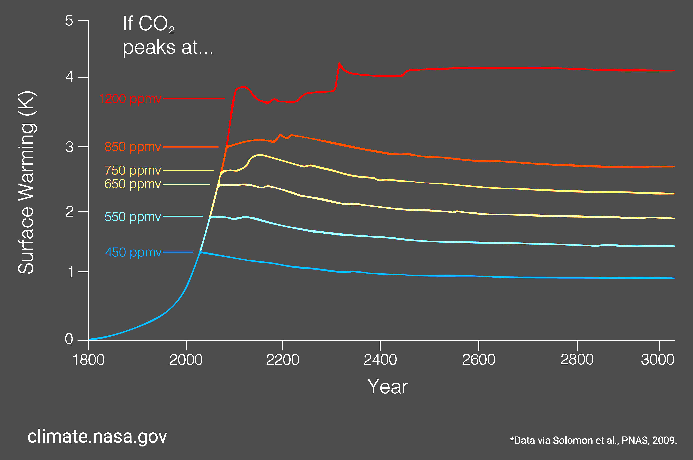
Source: NASA, with data via Solomon et al, PNAS 2009.
Note that temperatures rapidly stabilize and remain so for a millenium, with no end in sight. It is interesting to note that the blue line represents CO2 emissions ceasing with CO2 concentrations in the atmosphere of 450 ppm and the global average surface temperature at about 1.2ºC above the pre-industrial level around 1800. Those are nearly today’s conditions — 1.2ºC above pre-industrial levels and CO2 concentration about 420 ppm.
This puts our future climate in the hands of policy-makers around the world — the people who write our climate policy and determine when (and if) those policies will result in net zero emissions. That date will mark the average temperature of our future climate. We know for sure that it will be at least 1.2ºC above pre-industrial levels…
What About the Other GHGs?
The previous example looked at CO2 in isolation. While CO2 may have been the prime driver for climate warming to date, the other GHGs have a significant and growing impact. Currently Methane, Nitrous Oxide and the F-gases represent roughly 24% of total greenhouse gas emissions.
Methane
Methane has more than 80 times the warming power of CO2. However, methane remains in the atmosphere an average of just 12 years, so it doesn’t accumulate like CO2. Nonetheless, continuous methane emissions account for about 30% of climate warming to date. Methane has natural sources, primarily from wetlands via anaerobic decay of vegetation.
Human-caused methane emissions first exceeded natural emissions in the 1980s and have steadily accelerated ever since. Anthropogenic methane sources include energy production from fossil fuels, decomposition of waste in landfills, livestock emissions, and rice paddies (think artificial wetlands.) Livestock-related emissions make up 32% of anthropogenic methane emissions worldwide. Rice paddies account for another 8%.
Nitrous Oxide
Nitrous Oxide is produced naturally from atmospheric ammonia and from nitrogen in soils. The majority of human-generated nitrous oxide comes from nitrogen-based fertilizers, with the remainder originating from fossil fuel combustion, biomass burning, and decay of livestock waste.
Nitrous oxide is less abundant than methane, but comparatively long-lived, persisting in the atmosphere for an average of 114 years.
F-Gases
Flourinated gases are almost entirely man-made. Some are very powerful greenhouse gases and very long-lived, but fortunately F-gases make up only 2% of GHG emissions.
Where Does “Net” Zero Fit In ?
Net Zero is similar to the Zero CO2 Emissions scenario, but it goes beyond CO2 to encompass all GHGs. Net Zero is reached when all GHG emissions are equivalent to the GHGs being removed from the atmosphere, on a global scale. At global net zero, human activity is no longer increasing climate warming.
Crucially, Net Zero does not require that we completely eliminate all GHG emissions, only that the climate warming impact of any remaining emissions is balanced by the potential warming impact of other GHGs removed from the atmosphere. Thus, individual companies that are unable to reach zero emissions can still claim net zero status by laying claim to “carbon offsets” — typically in the form of forests or other natural carbon sinks.
Globally, Net Zero will require us to eliminate as much GHG emissions as humanly possible. There will be residual emissions from sources like aviation and agriculture where it is impossible or impractical to completely eliminate emissions. In order to reach Net Zero we will have to remove enough carbon from the atmosphere to balance all such residual emissions world-wide.
In order to stop climate warming, Net Zero must be achieved at a global level. It must also be permanent, meaning that any greenhouse gases removed from the atmosphere are not re-released.
The Transition to Net Zero
Let’s revisit “The Transition to Zero CO2 Emissions” in a net zero scenario, using all the GHGs and considering a slower, more realistic decrease in emissions. This scenario also introduces a new type of emission that is not a greenhouse gas — aerosols.
Aerosols are minute particles suspended in the atmosphere. By reflecting incoming sunlight back out to space, aerosols have a cooling effect on the earth’s climate. Aerosols blasted into the stratosphere by violent volcanic eruptions can spread around the globe, sometimes cooling the climate for several years. Human activities also generate aerosols, in particular sulfate aerosols created by the burning of fossil fuels. Sulfate aerosols are highly reflective and produced in large quantities in industrialized regions. Thus the concentrations and cooling effects of sulfate aerosols are greater in eastern North America, Europe, and China. Although sulfate aerosols are short-lived (3-5 days), human activity is constantly producing more. On the bright side, sulfate aerosols will quickly diminish with effective emissions controls.
The following graph from the IPCC Special Report: Global Warming of 1.5ºC (SR15) provides a more nuanced view of a hypothetical transition to net zero, highlighting the contribution of GHGs other than CO2.
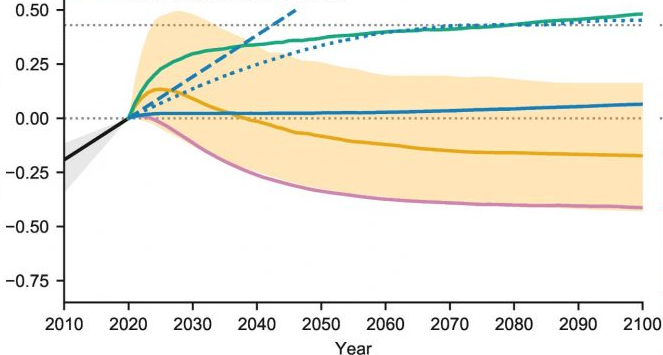
Source: IPCC SR15, the Special Report on Global Warming at 1.5C (2018)
The experiment used a variety of model simulations to consider different combinations of GHGs and aerosol emissions suddenly reduced to zero in 2020. The vertical axis marks temperature divergence in ºC from the 2020 starting temperature. The black line shows the average rate of warming during the 2010s, and the dashed blue line extrapolates temperatures beyond 2020 if the rate of warming is unchanged. The topmost horizontal dotted line represents warming of 1.5ºC above pre-industrial levels (roughly 0.4ºC above the 2020 level.)
As in the earlier graph, if CO2 emissions are eliminated in 2020, but the warming/cooling effects of other GHGs and aerosols remain constant (blue line), then temperatures also remain nearly constant, increasing very slowly in response to the combined effects of other GHGs and aerosols. The heavy dotted blue line represents a more realistic scenario where CO2 reaches zero over a 50 year period, while non-CO2 GHGs and aerosols remain constant. The latter scenario shows the importance of rapidly decreasing emissions to slow climate warming.
If CO2 and aerosol emissions are reduced to zero in 2020 (green line), but other GHGs are unchanged, we see a rapid temperature rise as the cooling effect of the short-lived aerosols decreases, followed by a slow increase in temperature from remaining GHGs (predominantly methane).
In the case where all GHG emissions are set to zero in 2020 (purple line), temperatures initially fall quickly, as short-lived GHGs, like methane, dissipate and no longer counterbalance the cooling effect of aerosols.
In the more likely net zero situation, where all GHGs and aerosols zero out (yellow line), we see the combined cooling effects of aerosols and the warming effect of the GHGs result in a rapid, short term temperature increase as aerosol cooling disappears, followed by a more gradual cooling as the relatively short-lived GHGs degrade, ultimately leaving only the CO2 accumulated prior to our idealized “net zero.”
Timing is Everything
“If you find yourself in a hole, stop digging” Will Rogers
As we have seen in this lengthy post, the longer we wait to get serious about reaching net zero GHG emissions, the more difficult it will become to get out of the climate hole in which we find ourselves.
That said, we need to be realistic about the social and economic costs of the transition to net zero. Unlike our hypothetical scenarios, getting to net zero in real life will take time to create viable substitutes for fossil fuels as a primary energy source. Nor will changing agricultural practices to control nitrogen dioxide and methane emissions happen overnight. Nonetheless, the consequences of inaction are too disastrous to contemplate.
The following World Resources Institute graphic, based on the findings in the IPCC Special Report SR1.5 (2018), shows two difficult but doable paths to net zero.
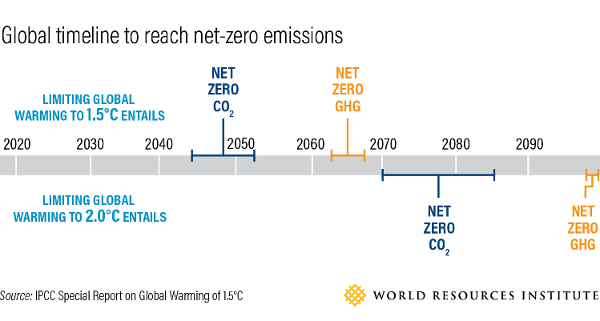
The two timelines prioritize reaching net zero CO2 as quickly as possible, to stop accumulating the most long-lived and abundant GHG. Reaching net zero for all GHGs can happen later.
The 2022 IPCC report, The Sixth Assessment Report (AR6), Working Group 3, (pdf) has the benefit of better models for non-CO2 greenhouse gases, and presents a more detailed set of timelines for potential pathways limiting warming to 1.5ºC or 2ºC. Interestingly, all of those pathways rely on significant levels of carbon dioxide removal (CDR) in the latter half of the century.
None of the feasible pathways can limit warming to 2ºC without CDR — technologies that have yet to show they will be viable at scale. We will review potential CDR solutions in the near future. In the meantime, you can read our post on Direct Air Carbon Capture (DACC) to get a feel for the state of the art.
We’ll leave you with this thought-provoking fact: The last time global surface temperature was sustained at or above 2.5°C higher than 1850–1900 was over 3 million years ago.