
The Science Behind Heatwaves
The heatwaves highlighted in Part 1 continued through the rest of the summer, amplifying the continuing plague of wildfires and drought around the Northern Hemisphere. Droughts in China and Europe reduced major rivers to a trickle, hampering shipping and hydroelectric power generation.
In Part 2, we look at how heatwaves form and the many ways that climate warming is making heatwaves more intense and more frequent.
How Do Heatwaves Form?
Summer heatwaves in the mid-latitudes typically occur under a slow-moving high-pressure weather system (an anticyclone). Clear skies allow the strong summer sun to heat the surface and the air above it. Beneath large areas of strong high pressure, a “heat dome” can develop, trapping and amplifying the heating of the recirculating air within it, as shown below.
Video Credit: Royal Meteorological Society
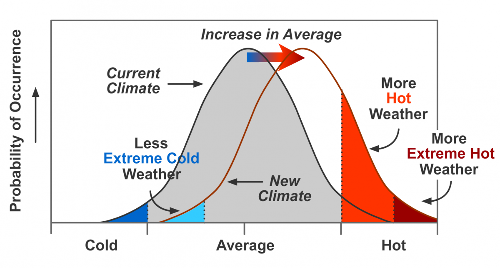
Impact on extreme events of a change in climate Credit: Climate Signals
The concurrent Northern Hemisphere heatwaves in 2022 are partly a consequence of the rightward shift of the climate curve in the preceding graph. Simply put, the more heatwaves there are, and the longer they last, the more likely it becomes that two or more heatwaves will occur simultaneously in different locations.
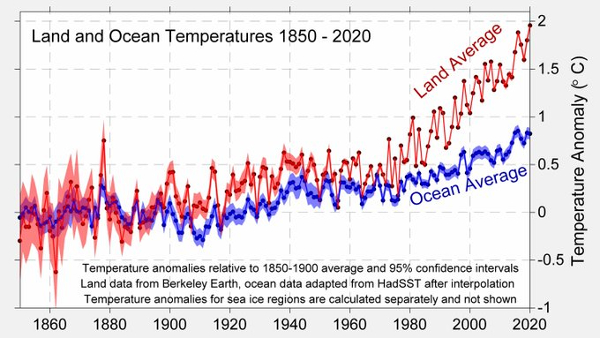
Over the last decade, the world warmed by 0.25 °C, in-line with the roughly linear trend since the 1970s. A 2021 study by Alexander Robinson and others shows that this seemingly modest rate of warming has led to the appearence of heat extremes that would be “virtually impossible without anthropogenic global warming.”
…we are now entering an era with heat extremes that simply would not have occurred without climate change. Robinson et al, 2021
But this isn’t the whole story. Other climate processes affect heatwaves:
- atmospheric dynamics, and
- land-atmosphere feedbacks
Atmospheric Dynamics
Northern Hemisphere atmospheric circulation is fundamentally driven by the difference in temperatures between the tropics and the Arctic. Over the last four decades of climate warming, the Arctic has warmed nearly four times as fast as the rest of the world — a phenomenon known as Arctic Amplification. The resulting reduction of the tropics/Arctic temperature difference is thought to be weakening and changing the behavior of the jet stream.
The formation and duration of heatwaves in the mid-latitudes is strongly affected by the jet stream. A weaker jet stream is susceptible to large waves or meanders in the upper atmosphere. The west to east flow of the jet drives these waves eastward. However, as the jet weakens these meanders are more likely to stall in place, leading to the persistent anticyclone weather patterns that drive the intensity and duration of heatwaves.
Since 1980, Europe has become a “heatwave hotspot,” with an upward trend in heatwaves three- to four-times faster than the rest of the Northern Hemisphere mid-latitudes. This is thought to be due, in part, to an increase in the frequency and duration of events in which the jet stream splits into two jets over Eurasia. The weak winds between the two jet streams favor the development of the persistent high pressure systems associated with heatwaves.
Ocean-atmosphere interaction also contributes indirectly to heatwave formation. In the Pacific, the El Nino Southern Oscillation (ENSO) is strongly linked to mid-latitude summer weather. 2022 marked the third consecutive year for the La Niña phase of ENSO. The La Niña events are characterized by cold surface water in the Eastern Pacific, which interacts with the atmosphere to push the jet stream northward. This leads to persistent weather conditions favoring extreme summer heat events, including anticyclones over the west and east coasts of North America, Europe/Central Asia, and Northeast Asia.
While the potential impact of climate warming on ENSO is unclear, it’s possible that a jet stream weakened by Arctic Amplification is even more susceptible to further disruption by La Niña events.
Land-Atmosphere Feedbacks
Recent research into the evolution of the catastrophic 2021 western North America heat wave has advanced our understanding of how land-atmosphere interactions can amplify heatwave development and intensity.
In June and July of 2021, western Canada and the U.S. Pacific Northwest were hit by an extreme heatwave event. Temperature records were broken throughout the region, with multiple locations reaching temperatures over 40ºC. Records were not broken by tenths of a degree — they were shattered by tens of Celsius degrees. The extent and intensity of the event is illustrated in the figure below. The temperature scale to the right of the figure represents the temperature anomaly in Celsius degrees — the amount the recorded temperature deviated from the long term average for the location and date.
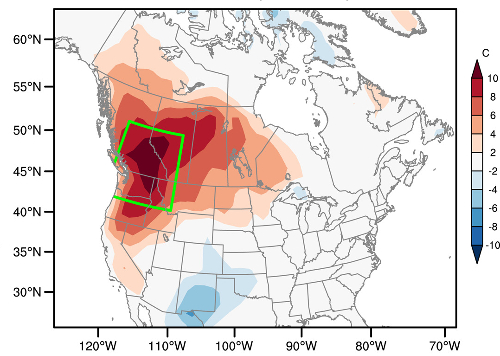
Map source: Lin et al (2022)
Lytton, British Columbia, set an all-time Canadian daily maximum temperature record of 49.6ºC (121.3ºF). The heatwave caused more than 1,400 deaths, and sparked numerous wildfires. Damage in the U.S. alone is estimated to be in excess of $9 billion.
Even taking climate warming into account, a heat event of this intensity was thought to be virtually impossible — a one in 10,000 year occurence. Recently released research found that land-atmosphere feedbacks related to local climate warming amplified the event’s intensity by about 40%.
Long-term gradual warming and a related decline in soil moisture, coupled with a hot, dry period prior to the event, were catalysts for the explosive heatwave that followed. In the absence of soil moisture, and with already parched vegetation, very little of the heat energy received at the surface was consumed by evaporation. Heat radiated by the ground amplified the heat dome effect in a positive feedback loop.
The research found that gradual climate warming in the Pacific NorthWest has transformed this event from a 0ne in 10,000 year occurrence to an estimated one in 200 year occurrence today. The likelihood of an equal or even stronger event is projected to increase rapidly with continued climate warming at today’s rate, potentially becoming a one in 10 year event in the mid-2050’s.
Future Heatwaves
We have currently warmed the global climate by about 1.3ºC above preindustrial levels. At current rates of warming, we are likely to reach 1.5ºC of warming in the 2030’s, and 2ºC in the 2050’s. As we’ve seen, the frequency, intensity and duration of heatwaves are strongly affected by climate warming, both directly and indirectly.
A very recent publication by Zepetello, Raftery and Battisti (2022) looked at future temperatures from a human health perspective, based on calculation of the heat index instead of predicted temperature. (The heat index combines temperature and relative humidity to assess the resulting heat stress experienced by a person.) Their probabilistic analysis combined the output of a wide range of climate models with a variety of socioeconomic variables to forecast locations where people will be at risk of heat exhaustion (a heat index value of 39.4ºC or 103ºF.)
Interestingly, their analysis estimates “there is only a 0.1% chance of limiting global average temperature change to the Paris Climate Agreement aspirational goal of 1.5 °C by 2100.” The estimate of the most likely outcome by 2100 is a global average temperature 3ºC (5.4ºF) above pre-industrial levels, with the average land temperature roughly 3.9ºC (7ºF). As a reality check, 3ºC by 2100 is within the margin of error for the Climate Action Tracker 2.7ºC estimate based on commited government policies and actions.
The study’s “most likely” climate projection estimates that the 2ºC Paris Agreement goal will be met in the early 2050’s. Thus, the following figure allows for a convenient comparison of a 2ºC world (in 2050) and the more likely 3ºC world of 2100.
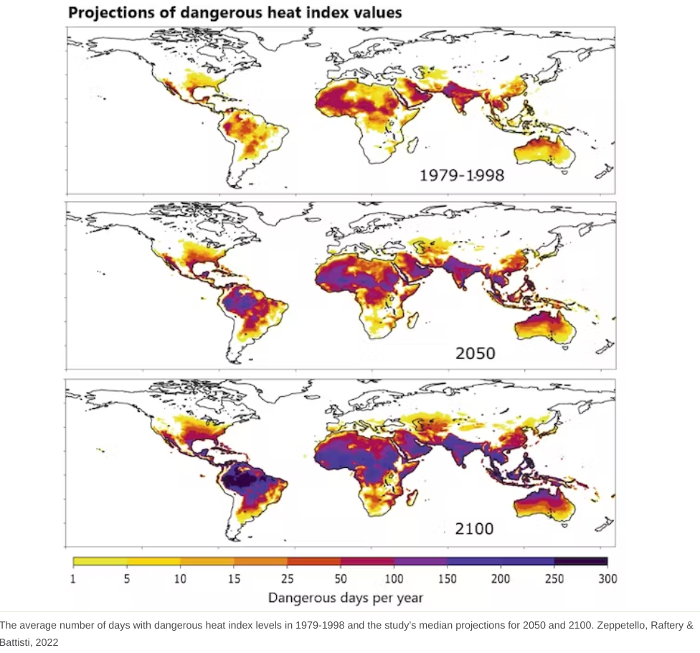
Image Credit: David Battisti, The Conversation
The potential impact on human health in tropical and subtropical regions will be significant. The authors state that: “In the tropics and subtropics, we project that, by 2050, many people living in these regions will likely experience dangerous Heat Index values on between one-quarter and one-half of all the days in each year. By 2100, the median projection is that most regions in the tropics and subtropics will exceed the dangerous Heat Index threshold on most of the days in each year.”
This study has some limitations — for example, it doesn’t account for the carbon removal programs currently planned (although not built.) Nonetheless, in our view its forecast through 2050 is consistent with current climate data, government climate policies and model predictions. In turn, this suggests that further evolution of the probabilistic approach to account for government commitments, and the impact potential impact of new technologies could lead to a very useful long-range forecasting and planning tool.
A more conventional investigation (pdf) focused on extreme heatwaves under the 1.5ºC and 2ºC Paris Agreement goals. In the 1.5ºC scenario, the intensity of heatwaves is projected to increase over most of the globe, particularly in Africa, Central and South America, and Southeast Asia. In a 2ºC world, the study projects exceptional heat waves, comparable to the 2010 Russian event, especially in Algeria, the Horn of Africa, and the Arabian Gulf.
At the same time, the results suggest that heatwaves will also become more frequent. In a 2ºC scenario, for most of the tropics severe heatwaves will become a one in five years event, and extreme heatwaves will be expected once every 20 years (particularly in Africa and Southeast Asia.
Regardless, the consensus is that future heatwaves will be more frequent and more intense. This is not just a long term problem — we can count on steady, significant changes in the behavior of heatwaves from now through 2050.