How the Ocean Is Driving El Niño and What It Means
Something extraordinary is happening beneath the surface of the Pacific Ocean right now. A massive pulse of warm water, stretching thousands of kilometers and running hundreds of meters deep, is surging eastward from Asia toward South America. Forecasters at NOAA’s Climate Prediction Center and the International Research Institute (IRI) at Columbia University suggest that there is a 96 to 98% chance this underwater heat wave will produce a fully developed El Niño by the end of 2026. Not only that, we may be looking at a historically intense “Super El Niño,” with dramatic impact on hurricane season in both the Pacific and Atlantic Oceans, as well as severe weather events around the world. But first, let’s step back and look at how El Niño’s and La Niña’s happen in the first place, and the role of the Southern Oscillation.
What Exactly Is the El Niño/Southern Oscillation?
El Niño and La Niña are opposite phases of the El Niño/Southern Oscillation (ENSO), rated by the World Meteorological Organization (WMO) as one of the most powerful climate patterns on Earth.
ENSO involves a pattern of seasonal interconnected changes to sea surface temperatures and atmospheric circulation in the tropical Pacific Ocean. The Southern Oscillation Index (SOI) tracks the atmospheric element of the pattern, while the Oceanic Niño Index (ONI) tracks the ocean element.
Think of the Pacific Ocean as a bathtub, with the water sloshing back and forth. In normal times, the easterly trade winds blow steadily from the Americas toward Asia, pushing warm surface water westward. There is a narrow boundary layer, called the thermocline, separating the warmer, mixed water near the surface and the colder, dense water below. As the warm water piles up near Indonesia and Australia, the thermocline is forced downward. Meanwhile, the eastern end near South America stays cooler as upwelling cold water from the deep ocean rises to fill the gap along the South American coast, as shown in Figure 1.
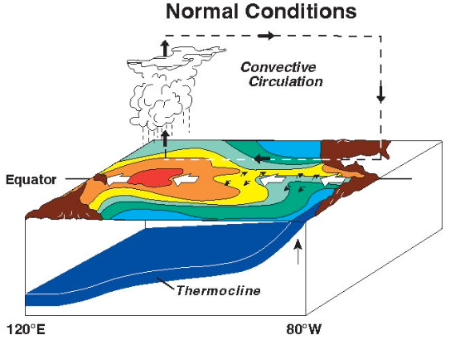
Figure 1: Typical Pacific circulation Credit: National Weather Service
This trade wind-driven circulation forms the lower branch of a large atmospheric loop called the Walker Circulation, first described by the British meteorologist Sir Gilbert Thomas Walker in 1923. The upper branch flows back east high in the atmosphere, completing the loop. This looping circulation is duplicated in equatorial basins and continents around the world, linking Pacific Ocean temperatures to weather patterns across Africa, Asia, and South America, as shown in Figure 2.
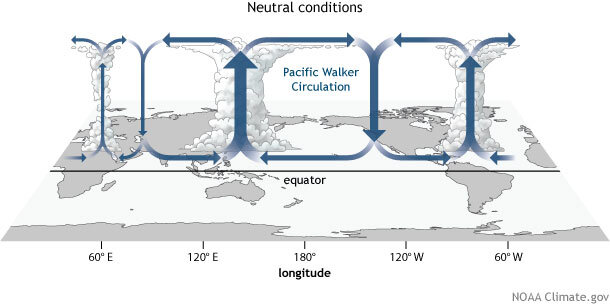
Figure 2: Neutral Walker Circulation (neither El Niño or La Niña). Width of the arrows represents the relative strength of the circulation.
In the Pacific basin, the normal or neutral Walker circulation is characterized by relatively low surface air pressure in the western Pacific, where convective circulation drives the air upward. Conversely, the downward side of the loop in the eastern Pacific is associated with relatively high surface pressure. This pressure difference drives the east to west flow of the easterly trade winds.
Every few years, the easterly trade winds blowing along the equator weaken. The warm water that had piled up in the western Pacific sloshes back eastward and sea surface temperatures in the central and eastern Pacific spike (Figure 3). That’s an El Niño event. When it happens, the Walker Circulation weakens and shifts, causing cascading effects across the globe: droughts in Australia and Southeast Asia, heavy rains in South America, warmer winters in Canada, disrupted fisheries, and dramatically altered hurricane patterns in both the Pacific and Atlantic Oceans.
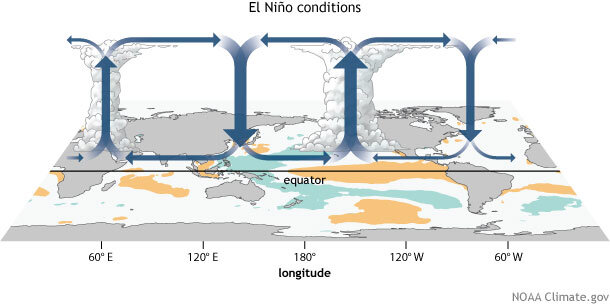
Figure 3: An El Niño version of the global Walker Circulation
How the Ocean Built This El Niño
A La Niña Event Set The Stage
During 2025, the Pacific was in the opposite La Niña phase, with stronger than normal trade winds driving an unusual accumulation of warm water in the western Pacific, similar to Figure 1. According to the IRI January 2026 report, La Niña was clearly present, with the Pacific displaying characteristically cool eastern and warm western sea surface temperature anomalies. In the following months, IRI noted a steady weakening of La Niña conditions, including the easterly trade winds.
Subsurface Waves Started The Process
When the trade winds begin to relax, the accumulated warm water in the western equatorial Pacific does not simply spread out evenly in all directions. It launches a specific type of ocean wave, called an oceanic Kelvin wave, that travels beneath the surface eastward along the equator. Invisible from above, these waves are tracked by NOAA’s Tropical Atmosphere Ocean (TAO) array, a network of 55 moored buoys spanning the equatorial Pacific, built specifically to monitor El Niño and La Niña development.
As a Kelvin wave passes, its mass of warm water pushes the thermocline downward in the east, suppressing the upwelling that normally keeps eastern Pacific temperatures cool and warming the sea surface in its wake, as shown in Figure 4.
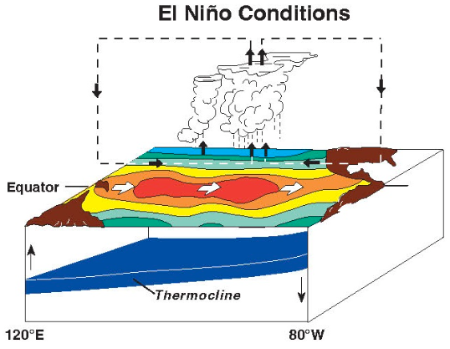
Figure 4: The coupled changes in the atmosphere and the ocean characteristic of El Niño conditions.
As the east-to-west trade winds weaken, periodic outbreaks of west-to-east winds called Westerly Wind Bursts interact with the ocean to help create equatorial Kelvin waves, pushing them across the Pacific toward South America. Because westerly wind bursts happen along the equator, they can simultaneously trigger “twin” cyclones, one spinning counter-clockwise north of the equator, and one spinning clockwise south of the equator, creating more Kelvin waves carrying warm water eastward.
In April 2026, a rare “triplet” cyclone weather pattern developed in the Pacific Ocean. The alignment featured two cyclones in the South Pacific (Maila and Vaianu) and Super Typhoon Sinlaku in the Northern Hemisphere. This unusual formation triggered strong wind bursts, accelerating a massive pulse of warm water eastward, further fueling the development of a potentially record-breaking El Niño.
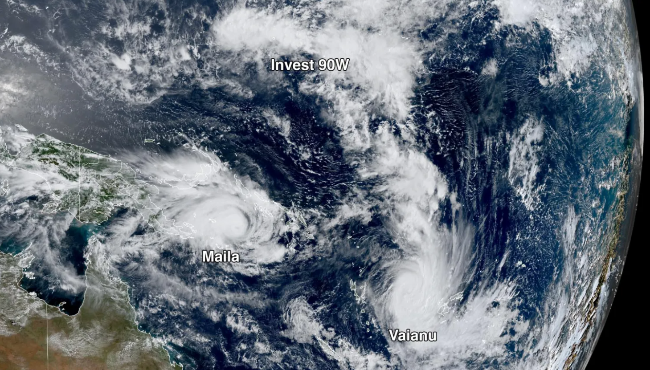
Figure 6: “Triplet” Cyclones, early April 2026. Invest 90 underwent rapid intensification to become Super Typhoon Sinlaku. Credit: Yale Climate Connections
El Niño develops as multiple Kelvin waves develop over the course of several months, and the warm water accumulates off the shores of Colombia, Ecuador, and Peru.
The current Kelvin wave signal in the Pacific is one of the most powerful on record for this stage of an ENSO cycle. As of mid-May 2026, IRI reports that weekly sea surface temperature anomalies (temperatures above or below the long term average) in the key central Pacific monitoring region have surged well above the El Niño threshold (0.5°C above average) to +0.9°C, a sharp upward shift from the April anomaly of +0.47°C.
A Feedback Loop Keeps It Going
Once warm surface temperatures emerge in the central and eastern Pacific, the process becomes self-reinforcing through what climate scientists call Bjerknes feedback, named after the Norwegian/American meteorologist Jacob Bjerknes who first identified it in 1969. ENSO events are inherently coupled ocean-atmosphere phenomena: in the case of an El Niño event, warmer sea surface temperatures weaken the Walker Circulation and the easterly trade winds, which in turn reduces cold water upwelling and allows sea surface temperatures to warm further, which further weakens the winds, and so on. This positive feedback is what gives El Niño its characteristic self-sustaining structure once initiated.
The 2026 El Niño will grow steadily stronger until other negative feedback loops, such as the depletion of warm water in the western Pacific, cause the system to peak and eventually reverse.
Why 2026 Could Be Particularly Significant
Let’s start by comparing sea surface temperature anomalies for May 20 in 2025 (neutral conditions, transitioning to La Niña) and May 20, 2026. In May 2025 the majority of the tropical Pacific Ocean shows temperatures equal to, or slightly below the 1991-2020 baseline, in line with a neutral-transitioning-to-La-Niña situation.
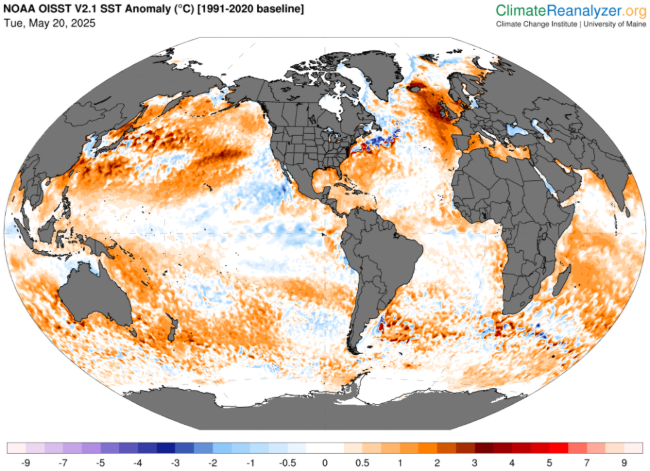
Figure 7: SST anomalies for May 20, 2025.
Contrast the graphic above with the sea surface anomalies map for May 20, 2026, shown in Figure 8, below.
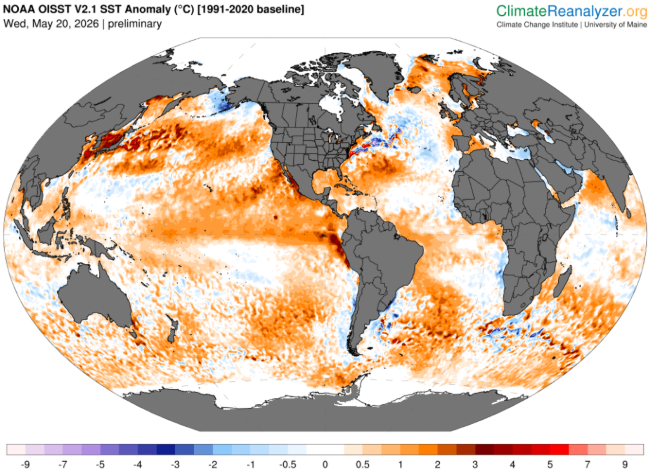
Figure 8: SST anomalies for May 20, 2026.
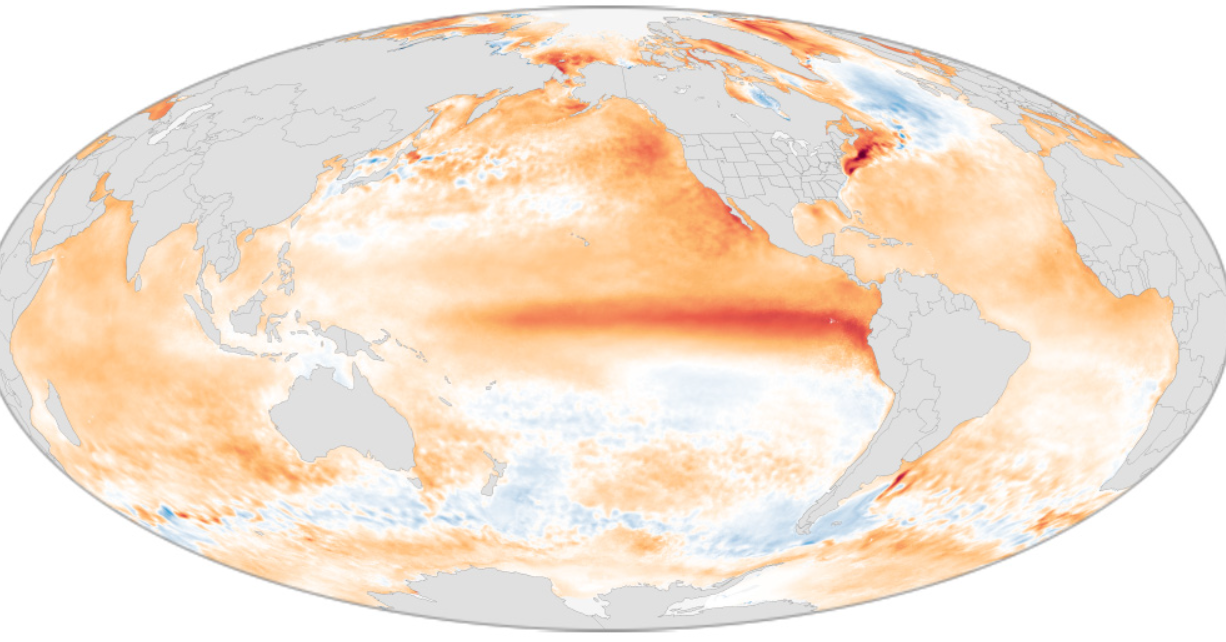
The 2026 map shows the Pacific Ocean primed for El Niño development, with anomalously warm surface water spreading eastward near the equator, with much warmer than average water accumulating along the coasts of North and South America.
Forecasters agree — an El Niño is in the cards for 2026. The question is: how strong will this El Niño be? This early in the development process it is impossible to tell, however early predictions suggest near-equal probabilities for a moderate, strong or very strong (“Super”) El Niño.
NOAA’s May 2026 ENSO Diagnostic Discussion, the agency’s official monthly assessment, rates the probability of an El Niño event at 82% for May–July 2026 and 96% for December 2026–February 2027. IRI’s model-based May forecast puts the probability even higher, at 98% for May–July.
NOAA’s Eastern Pacific Hurricane Season Outlook, issued May 21, 2026, notes that the agency’s ENSO forecast models now show a 96% chance of El Niño conditions during the Pacific hurricane season (May 15 to November 15), with a 66% chance of a moderate or stronger event during the July–September peak period. Many of the agency’s models suggest reaching strong to very strong El Niño conditions by mid-summer.
Forecasters also note that the developing El Niño is occurring on top of already-elevated global ocean temperatures, a context that was not present during earlier comparable events. In fact, El Niño years are typically warmer than average, so adding El Niño effects on top of climate warming could result in the hottest year ever recorded, well over 1.5°C above the pre-industrial average.
The Two Hurricane Seasons: Opposite Outcomes
El Niño produces dramatically different outcomes in the Eastern Pacific and Atlantic hurricane basins, and 2026 is a textbook example.
The Pacific: Above-Normal Activity Expected
For the Eastern and Central Pacific, El Niño is a turbocharger. When Pacific SSTs rise, the Walker Circulation weakens, reducing the upper-level wind patterns that normally inhibit storm development. NOAA’s official May 2026 Eastern Pacific Hurricane Season Outlook predicts an environment with below-normal vertical wind shear and above-average sea surface temperatures across the storm development regions. NOAA estimates a 70% chance of an above normal hurricane season
The NOAA overview: “El Niño conditions lead to more hurricane activity in the eastern and central Pacific. For the eastern Pacific, El Niño years average 13–18 named storms and about 30 more Accumulated Cyclone Energy [ACE] points on average than La Niña years. For the central Pacific, average activity during El Niño years ranges from 2–8 tropical depressions and storms, while during La Niña years typical activity ranges from 0–4 [storms]”.
NOAA’s official 2026 Eastern Pacific forecast predicts:
- 15–22 named storms
- 9–14 hurricanes
- 5–9 major hurricanes
The majority of these storms are likely to never make landfall, but it only takes one… A recent example is Hurricane Otis, which struck Acapulco, Mexico in October, 2023. Originally a small tropical storm, Otis underwent explosive intensification to Category 5, becoming the strongest Pacific hurricane to ever make landfall. So far…
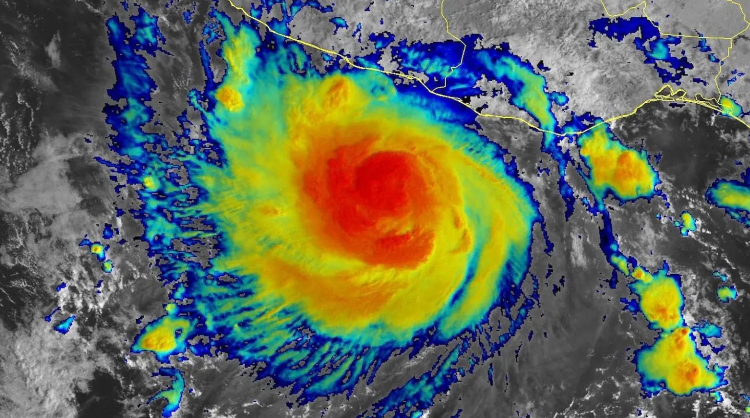
Figure 9: Hurricane Otis approaching Acapulco, Mexico. Credit: NOAA
In the Central Pacific (Hawaii’s basin) NOAA forecast calls for 5–13 tropical cyclones, well above the long-term average of 4.4. This is not a landfall forecast, but the forecast notes that SST anomalies of 0.5–1.5°C above average in the primary storm formation region between 110°W and 140°W are already in place, so we can expect some activity.
The Atlantic: Below-Normal Activity Forecast
For the Atlantic, El Niño operates in reverse: as the tropical Pacific warms and the Walker Circulation weakens and shifts eastward, it generates stronger upper-level westerly winds across the Caribbean and tropical North Atlantic. The upper-level winds deliver vertical wind shear, disrupting developing hurricanes before they can organize and intensify. Nonetheless, climate warming has driven ocean temperatures well above the long-term average, providing plenty of fuel for tropical cyclone development should the opportunity arise.
The Climate Adaptation Center 2026 Hurricane Forecast predicted:
- 12 named storms
- 5 hurricanes
- 2 major hurricanes
NOAA’s official 2026 Atlantic Hurricane Season Outlook, issued May 21, 2026, gives a 55% chance of a below-normal season, forecasting:
- 8–14 named storms
- 3–6 hurricanes
- 1–3 major hurricanes
This compares to a 1991–2020 average of 14 named storms, 7 hurricanes, and 3 major hurricanes.
Remember, “below normal” does not mean “safe.” It only takes one storm, not even a direct hit, to cause massive damage and injury. Be prepared!
What Comes Next?
As of mid-May, 2026, NOAA’s Climate Prediction Center forecast that El Niño would reach peak intensity near year-end. At this stage in its development, predictions suggest that this El Niño will be strong — the question is “how strong?” Whether this event reaches moderate, strong, or very strong (super El Niño) intensity depends on how the Bjerknes ocean-atmosphere feedback develops through the summer.
What is already clear from official monitoring:
-
The IRI ENSO plume forecast assigns 97–98% probability to El Niño persisting through all of 2026
-
NOAA’s Eastern Pacific forecasters see a 70% chance of an above-normal Pacific hurricane season
-
NOAA’s Atlantic forecasters see a 55% chance of a below-normal Atlantic hurricane season, with El Niño-induced wind shear suppressing hurricane formation
-
Both the Pacific and Atlantic outcomes are dependent on the strength and timing of El Niño’s full development over the rest of the year.
The Pacific Ocean has been storing energy and heating up for years. It is now releasing it — and the effects will be felt around the globe, from fisheries off Peru, to hurricane tracks across both the Pacific and Caribbean, to rainfall patterns on every continent.
The ocean is running the show now.