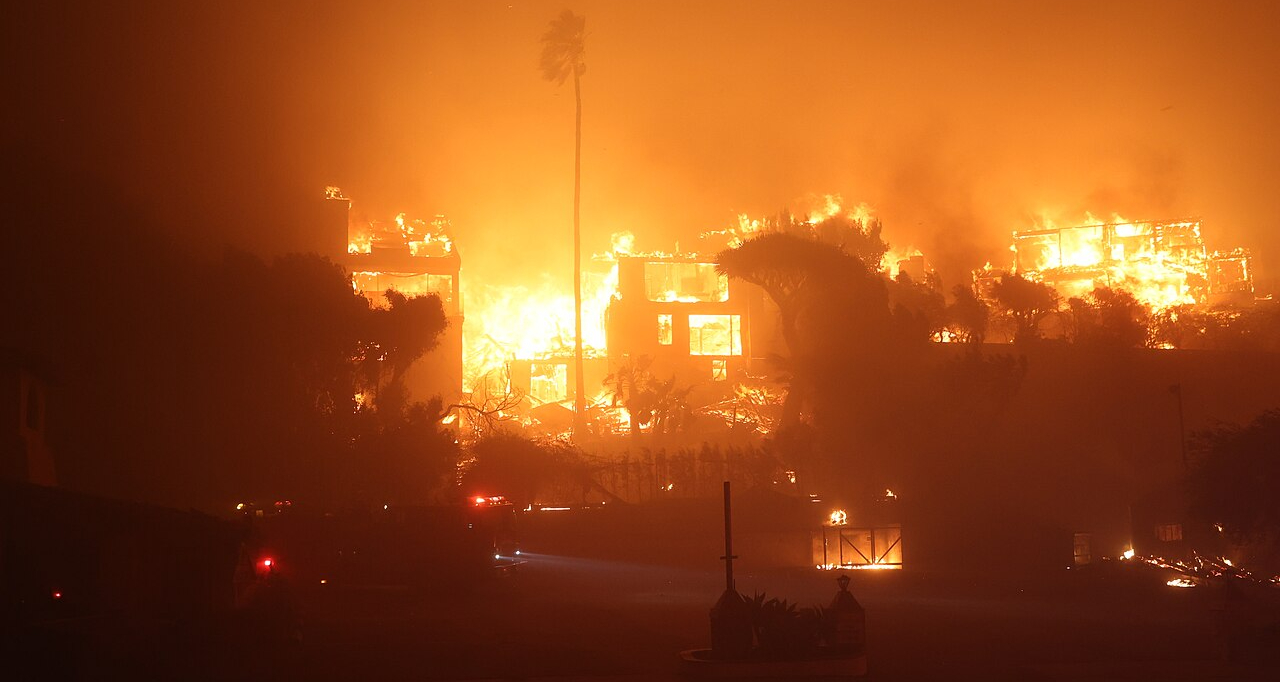
Palisades Fire, Los Angeles Credit: Wikimedia/CalFire CC BY
How Much Hotter?
Part 1 of this article set the stage with a short reality check on the state of the climate in early 2025 as we move on from 2024 — the hottest year ever recorded (so far). Part 2 takes a forward look at the rest of the 21st century — climate warming trends, the consequences of a hotter climate, and the pressing need for climate adaptation.
Climate Trends – 2025 to 2100
With the first four months of the year behind us, Berkeley Earth is able to estimate that 2025 has a 53% chance of being the second warmest year on record in the ERA5 database at 1.52°C above the preindustrial average, with an 18% chance of beating 2024 as the warmest and a 29% chance of ending up as the third warmest after 2023.
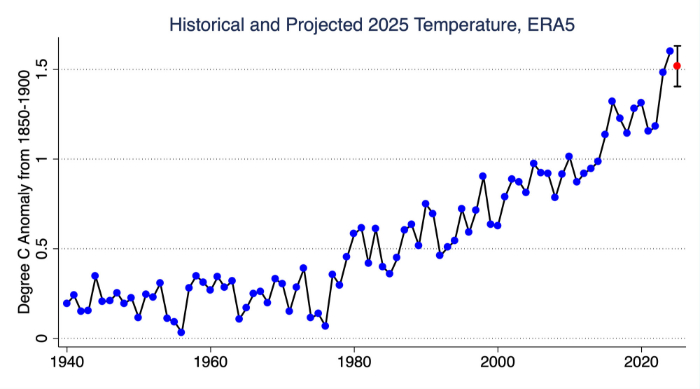
Figure 1: Yearly average global temperatures compared to the 1850-1900 average (2025 estimate in red) Credit: Z. Hausfather, Berkeley Earth
The ups and downs along the upward trend in annual average temperatures shown in Figure 1 are often attributable to the El Niño Southern Oscillation (ENSO) – a naturally occurring climate cycle in the Pacific Ocean. (Among other things, ENSO affects the Atlantic hurricane season.) In the short term, La Niña years are cooler than El Niño years. However, researchers at The World in Data observed that global temperatures are rising so rapidly that recent “cold” La Niña years were hotter than “hot” El Niño years a few decades before.
In a similar vein, Climate Central analyzed data from 243 U.S. weather stations, comparing 30-year averages of each site’s annual coldest temperature for two periods: 1951-1980 and 1995-2024. For 97% of the sites, the 1995-2024 coldest temperature average was higher than in 1951-1980. According to Climate Central, on a regional basis “the coldest temperatures have warmed the most in cities across Alaska (+7.8°F), the Northwest (+4.7°F), and the Southwest (+4.3°F).”
The day to day global impact of climate warming is shown below in Figure 2, based on daily global average temperatures in the ERA5 database. Notice the dramatic increase in temperature since 1940, particularly peak temperatures in July-August. (Global averages reflect the Northern Hemisphere seasons because most of the world’s land mass is north of the equator, and land areas heat and cool more rapidly than oceans.)
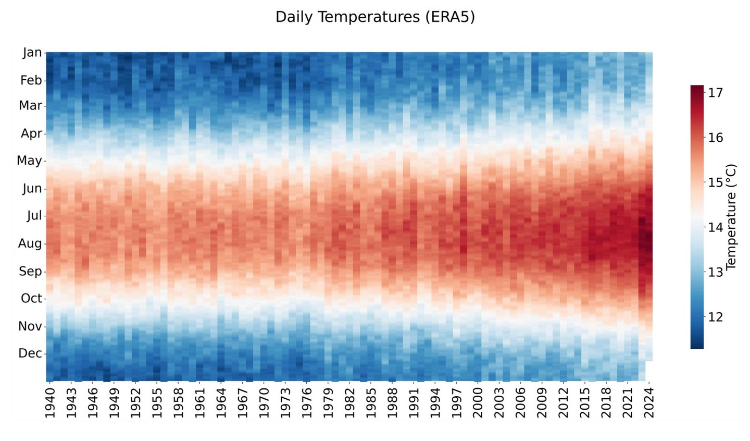
Figure 2: Daily global average temperatures Credit: Z. Hausfather
Future Projections
The graphic below shows a range of climate outcomes between now (the end of the black line) and 2100, based on the representative climate warming mitigation strategies tracked by the U.N. Intergovernmental Panel on Climate Change (IPCC). The signatories to the Paris Agreement, the 2015 international treaty on climate change, agreed to limit the future increase in global average temperature to below 2°C, with an aspirational goal of 1.5°C. Stopping global warming altogether requires limiting global emissions of greenhouse gases to “net zero”— a balance between remaining emissions and natural or man-made extraction of greenhouse gases from the atmosphere.
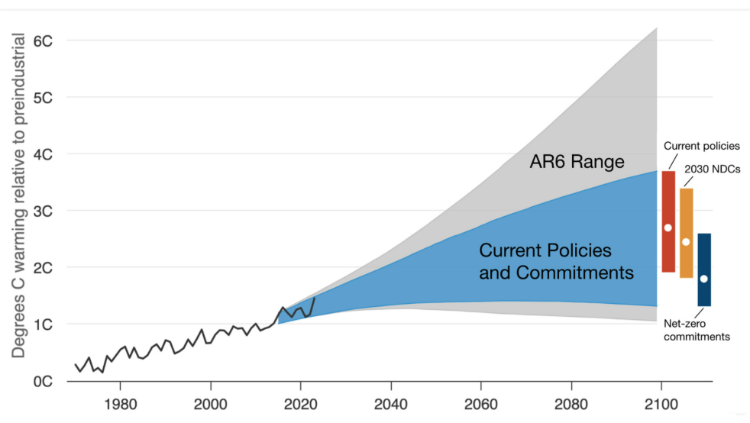
Figure 3: Climate warming through 2100 Credit: Hausfather and Moore (2022 and 2025)
The grey area represents the full range of possible outcomes projected by the IPCC in the 2023 Sixth Assessment Report (AR6). The blue area covers the conceivable range of outcomes based on current policies and commitments of the signatories to the Paris Agreement. The 2100 median estimate, given “Current Policies and Commitments,” is 2.7°C above the preindustrial global average temperature.
Unfortunately, AR6 was issued way back in 2023 and, as the saying goes, it’s been overtaken by events. The UN Environment Programme’s latest Emissions Gap Report 2024, flatly states that continuation of climate warming mitigation via current government policies has a 66% chance of resulting in 3.1°C of warming by 2100.
That’s a daunting number, considering the climate chaos we’re experiencing at less than half that. And remember, that’s a global average including the relatively cool oceans – temperatures over the land areas where people live will be much hotter.
We already have the proven clean energy sources needed to meet the 2°C goal of the Paris Agreement. The G20 nations, the principal drivers of global warming (contributing 77% of global emissions in 2023), have the resources and capacity to get the job done. Unfortunately, their priorities are elsewhere. Nowhere is that more evident than in the U.S., which has recently withdrawn entirely from the Paris Agreement and paused efforts to reduce greenhouse gas emissions. Other countries are likely to follow suit.
This is not to say that current and planned efforts to rein in the dramatic accumulation of CO2 and other greenhouse gases in the atmosphere are a waste of time. They are not. Every tenth of a degree of global warming that can be averted is important.
Nonetheless, we must face the fact that the rest of this century will deliver a climate much warmer than today. Planning for a 3°C world is now a necessity.
Consequences
The consequences of a potential 3°C world are much the same as the hazards the CAC has highlighted over the last five years, but going forward the hazards are bigger, more frequent and nastier. For a start, the list includes extreme weather, intense heat waves, the expanding range of insect-borne diseases, sea level rise, the death of coral reefs, wildfires fed by heat and drought, inland flooding from extreme rainfall events, and rapid intensification of tropical cyclones over warmer oceans.
We’ll cover all those issues in the coming months, but two consequences of the road to 3°C of warming deserve particular attention, in view of their ongoing global impact: the human health threat of accelerated warming, and the irreversible effects of sea level rise.
Heat
First and foremost, many of us can expect escalating heat and unrelenting heat waves. The CAC took an in depth look at future warming and heatwaves three years ago (Overheated: Summer 2002, Part 1 and Part 2). At that time we suggested that climate warming might reach as much as 3°C by 2100 — unfortunately, it looks like we were right.
The following graph shows how quickly the earth’s land areas are warming — much faster than the larger oceans and thus faster than the global average.
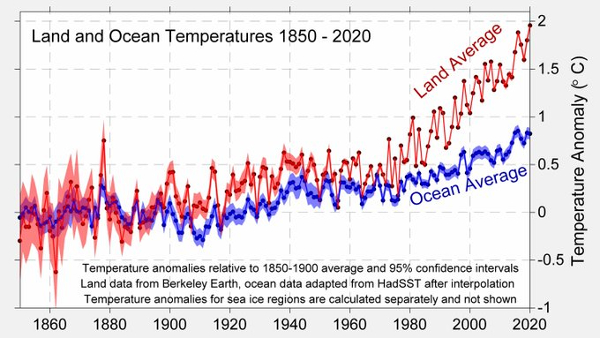
Figure 4: Source – CAC “Overheated: Summer 2002, Part 2” Credit: Berkeley Earth
The illustration below shows how the global distribution of temperature changes with an increase in the global average. As the climate warms toward 3ºC, the occurrence of temperatures that people experience as cold, average or hot will shift, with cold weather becoming less frequent, hot weather more frequent, and extreme hot weather setting new records.
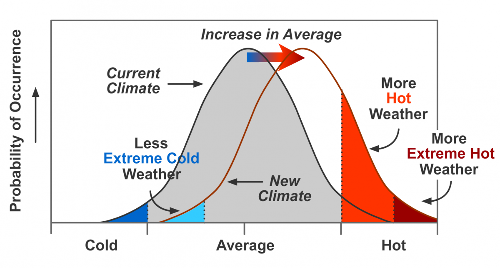
Figure 5: Source – CAC “Overheated: Summer 2002, Part 2” Credit: Climate Signals
In keeping with the general trend suggested in Figure 5, the World Health Organization found that between 2000 and 2016, the number of people exposed to heatwaves increased by around 125 million. The greatest risk lies in countries in or near the tropics, where temperatures already approach human limits. Conversely, higher latitudes, will benefit from a decrease in cold-temperature deaths as the climate warms.
In the U.S., more than 21,000 heat-related deaths occurred from 1999 through 2023, with the annual death toll more than doubling over the 24 years. A study of Europe’s 2023 heat wave found that it resulted in more than 47,000 deaths.
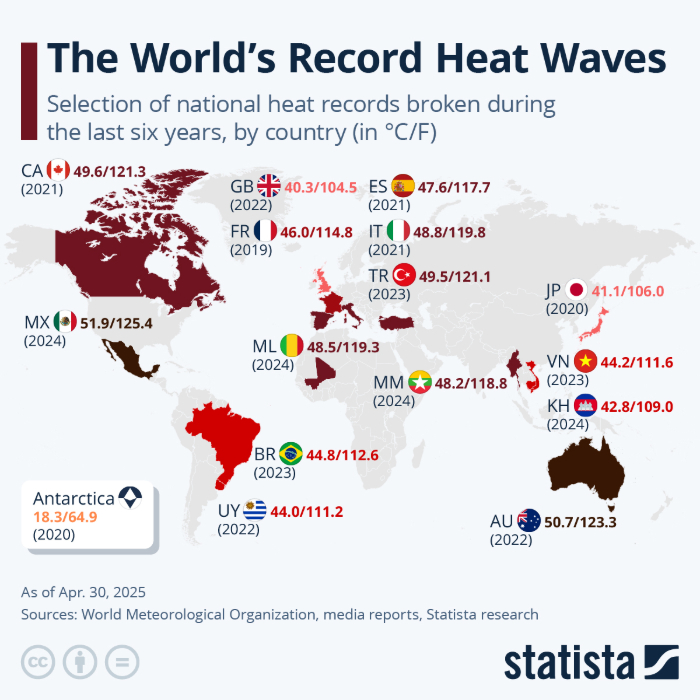
Figure 6: Record Heat Waves 2019-2025 Credit:Visual Capitalist
At the same time, our understanding of human health risks associated with rising temperatures is changing. We have known for some time that the human body loses its ability to regulate heat beyond a limit defined by a combination of heat and humidity.
Until recently, the theoretical limit was thought to be a 35°C “wet-bulb” temperature, equivalent to 35°C (95°F) at 100% humidity or 46°C (115°F) at 50% humidity. However, recent research at Penn State University showed that the wet-bulb threshold is actually lower — about 31°C (87°F) at 100% humidity for healthy, young adults. The threshold for older adults is significantly lower.
By 2050, the global population over 60 years old is forecast to be about 2.1 billion, roughly 21% of the total. Research by Giacomo Falchetta and colleagues predicts that as a result of rising temperatures, the number of people at risk worldwide from chronic extreme heat will at least double by 2050, with the population of older people regularly exposed to both chronic and acute heat increasing by about 200 million.
Sea Level Rise
In the U.S., 40% of the population lives along the coast, with New York and Miami ranked among the 20 global cities most at risk from coastal flooding. An OECD study (PDF) estimates that by the 2070s the global combination of sea level rise, extreme weather, subsidence, population growth and urbanization will triple the endangered population to around 150 million people. The economic impact could be even greater, with total assets at risk more than ten times current levels, reaching an estimated $35 trillion (USD) — roughly 9% of projected annual GDP. Much of the risk will reside in U.S. cities, as shown in Figure 7.
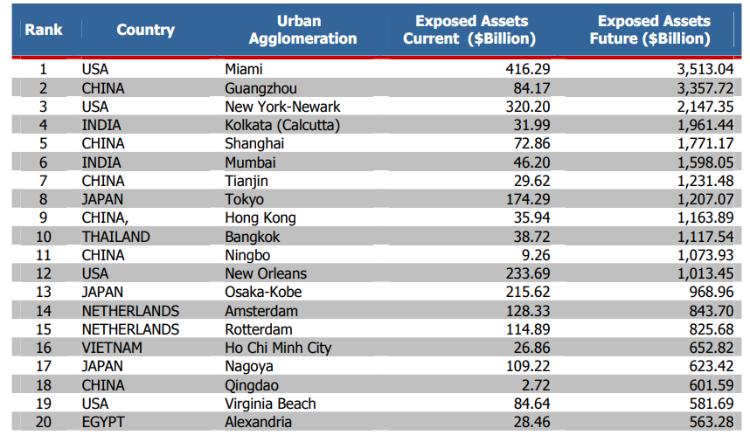
Figure 7: Top 20 cities ranked in terms of assets exposed to coastal flooding in the 2070s (including both
climate change and socioeconomic change) and showing present-day exposure Credit: OECD
Climate warming is causing global sea levels to rise, the result of thermal expansion of the warming oceans, and melting of land-based ice. From 1993 to 2023, global sea level rose about 10 cm (4 in). By 2050 sea level is predicted to rise another 15 cm (6 in) globally, and as much as 25 – 30 cm (10-12 in) in the U.S. It is likely that the inexorable changes set in motion by climate change will lead to about 1 m of sea level rise, perhaps by 2100.
The primary driver of accelerating sea level rise is the Greenland ice sheet. Currently the ice sheet is losing ice at the rate of 33 million tons an hour (20% higher than expected.) So far, the much larger Antarctic ice sheet is losing ice at about 136 billion tons/day, roughly half the Greenland rate. While estimating thermal expansion of the ocean is relatively straightforward, the ice loss driven by the various processes at work in the ice sheets is much harder to predict.
Local conditions can affect sea level rise. In the U.S. for example, sea level rise is slower in the Pacific Northwest where tectonic activity is pushing the land upward. On the other hand, sea level rise is much faster on the East Coast, where widespread subsidence is likely to lead to 36 – 54 cm (14–21 in) of sea level rise by 2050. The fastest rate of sea level rise in the U.S. is in the western Gulf of Mexico, which is expected to see a 49 – 69 cm (19 – 27 in) rise in the next 30 years.
The impact of sea level rise is amplified by increasing storm surges and high-tide flooding. High-tide flooding is now 3 to 9 times more frequent than it was 50 years ago.
As we’ve seen along the Gulf Coast, storm surges are amplified by sea-level rise, causing them to hit higher water levels and to penetrate farther inland. Louisiana is particularly vulnerable as climate change-driven sea level rise meets fast-sinking land. The state has one of the highest rates of land loss in the world.
And the sea level problem won’t go away. Consider NASA’s bleak view of future sea level rise:
“Beyond 2100, the consequences of sea-level rise could well force an inland retreat by human civilization to higher elevations. By 2150, storm surges likely will be twice as high, or higher, than they are today. And in general, after 2100, rising sea levels in the 3 to 6.5-foot range (1 to 2 meters) will cause widespread damage to coastal areas. Strategic adaptation will help at first – raising coastal structures and building extensive seawalls. But as the problem worsens, the continuing impact to society will be greater and the cost of responding will increase.”
Economic Consequences
Voluntary Migration
Globally, the U.S. is exceptionally vulnerable to physical damage fueled by climate change. In 2024, the U.S. counted nearly 80% of global insured losses due to natural disasters, with roughly half of those losses racked up by Florida, Texas, California, Louisiana and Colorado.
Following a year of climate disasters and property destruction in 2024, the economic impact of climate change on real estate value is front and center in the U.S. Residential real estate is currently valued at $50 trillion, dwarfing the U.S. GDP of $27.4 trillion. Needless to say, its impact on the economy is substantial. First Street, specialists in climate risk financial modelling down to the level of individual properties, recently released an analysis of future climate impact on U.S. property values — and their findings are alarming.
Climate change is disrupting the real estate market in two ways: changing where people would prefer to live, and increasing property insurance costs. Once attractive “Sunbelt” locations are becoming hotter, more dangerous, and consequently less desirable. Meanwhile insurance costs as a percentage of home mortgage payments ballooned from 7-8% in 2013 to more than 20% by 2022. First Street’s analysis shows that the largest Sunbelt states (Texas, California and Florida) were responsible for over 40% of U.S. natural disaster costs since 1980 — over $1 trillion. The Sunbelt is suddenly less attractive.
As we’ve seen in Florida, coastal regions are really paying the price of extreme weather driven by climate change. First Street reports that Miami insurance premiums have increased 322%, followed closely by Tampa (213%) and Jacksonville (226%).
The obvious response of the housing market is climate migration — voluntary relocation by homeowners to areas less exposed to the effects of climate change. First Street predicts that by 2055, 55 million people will decide to relocate to less vulnerable locations, driven by excessive heat, wildfires, flooding and drought.
Of course, the flip side is declining property values. The analysis suggests that roughly 70,000 neighborhoods affected by climate change will see property values fall as a result of rising insurance costs and falling demand. The economic impact? A total of $1.47 trillion in net property value losses.
Financial Institutions Are Recalibrating – The Rise of Adaptation
Recent reports indicate that the “big banks,” including Wall Street heavy hitters Morgan Stanley and JP Morgan Chase, are now planning for climate warming in the neighborhood of 3°C. The reports show that the big banks have done the analysis and determined that the Paris Agreement goals are effectively dead, shifting their planning to account for a hotter climate and the accompanying costly natural disasters.
The Institute of International Finance (IIF), in a 2025 report, stated “The world is not on track to limit temperature rise below 2°C – and limiting warming [to] 1.5°C is almost certainly unachievable, without a major step change in policy ambition.”
Morgan Stanley (an IIF member) was much more direct. “We now expect a 3°C world,” Morgan Stanley analysts wrote in March 2025 report. On the bright side, Morgan Stanley foresees a windfall for the air conditioning industry…
JP Morgan Chase, also an IIF member and the world’s largest bank by market capitalization, takes a more constructive approach in a 2025 report (pdf) “Building Resilience Through Climate Adaptation.” The report, authored by Dr. Sarah Kapnick, formerly chief scientist at NOAA, highlights two possible explanations for the lack of attention to adaptation so far:
- the natural tendency to avoid costly impacts by focusing on slowing or stopping climate change
- sufficient climate change to experience financial effects from extreme weather and climate events is only starting to be apparent.
Kapnick points out that 90% of climate finance to date has been focused on mitigation, with adaptation receiving less than $65B per year. By 2030, effective adaptation will require six times that amount annually, but that will be money well spent. The return on investment for climate adaptation is projected to range from $2 to $43 for every dollar spent.
Figure 8 shows the frequency and cost of U.S. billion dollar disasters as of April 2025, emphasizing the financial risk of going on with business as usual. The chart is noteworthy in that it accounts for the impact of inflation on the ability to compare costs over time. The resulting graphic includes events with less than $1B in damage at the time of the event, but that now exceed $1B in damage after adjustment for inflation.
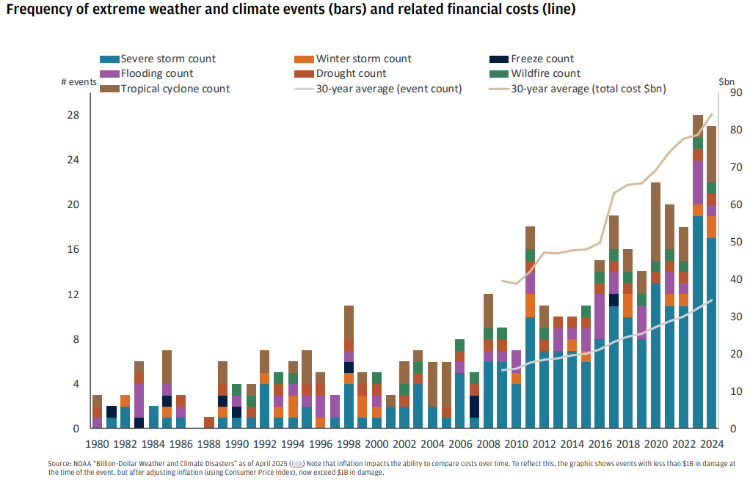
Figure 8: U.S. billion dollar disasters since 1980 (costs CPI-adjusted) Credit: JP Morgan (PDF)
The frequencies and costs of these events are growing. To counter these growth trends, we need to reduce the sources of change by:
- mitigating climate change through emissions reductions
- investing in resilience to reduce vulnerability and thus costly damage
As financial impacts of disasters are becoming attributable to climate change with measurable impact, the data can be used to provide actionable analyses of exposure to climate risks. Quantitative exposure models enable meaningful projections of future exposure.
S&P Global used just such a process to estimate the total cost of climate physical risk for the world’s largest companies in the S&P Global 1200, representing 70% of global market capitalization. Following our current climate trajectory, without adaptation the projected costs for those companies will reach $1.2 trillion annually by 2050. To put this in perspective, total damage from major extreme weather and climate events in the U.S. since 1980 totals $2.9 trillion
Utility companies are projected to experience the largest costs from climate physical risk. The S&P analysis estimates the average electrical utility in the analysis will experience $4.6B in costs annually in the 2050s, without adaptation. (Not surprisingly, utilities are actively pursuing adaptation planning.)
The S&P report concludes: “… the projected financial costs of climate physical risks are substantial due to the amount of warming that has already occurred. That reality makes adaptation and resilience central to addressing the physical risks of climate change now and over the years to come.”
In the CAC view, that message holds true for society as a whole, not just large corporations.