Conditions are Right for a Busy Hurricane Season. Again.
(A version of this article also appears in Sarasota Magazine)
The Year So Far
The Climate Adaptation Center issued its first 2021 Hurricane Forecast on April 15th.
At that time, we forecast 20 named storms for 2021. The CAC was the first organization to make publish its 2021 forecast and the only one to forecast such an active season for tropical systems. On June 15th we took another look at the forecast was revisited and reaffirmed our prediction.
Now peak hurricane season is about to arrive and it’s time to take another look. The most severe storms typically occur from late August into November, with peaks around September 10th and in early October, the most dangerous time for storms along Florida’s west coast.
After a record season in 2020 with 30 storms and four Category 4 storms, this season may seem meek in comparison but if you are feeling that way, let me try to change your perspective.
Thus far in 2021, Ana, Bill, Claudette, Danny, Elsa, Fred and now Grace have formed. Hurricane Elsa was the earliest 5th storm in history. Grace, our 7th storm, is earlier than the historical average, but last year the 7th storm formed even earlier, on July 22nd The 2021 season is very active so far, but not quite as active as 2020.
What’s Next?
Going forward, I am looking at three major factors: a phenomenon called the Madden-Julian Oscillation (MJO) discovered by two of my National Center for Atmospheric Research (NCAR) colleagues during my tenure at this world-renowned research center, Sea Surface Temperatures (SSTs), and finally the absence or presence of La Niña.
The MJO is an oscillating large-scale system that features downward motion over half its range and upward motion over the other half. When the downward motion is over the Atlantic Basin, which includes the tropical Atlantic, Caribbean and Gulf of Mexico, it tends to suppress storm formation because sinking air-dries the atmosphere. On the other hand, rising air enforces the upward motion that creates clouds, precipitation and related storms.
The MJO moves around the world and can be a critical factor in enhancing a hurricane season if it is over the Atlantic Basin during peak season. It is now moving into the Atlantic so for the next few weeks at least, this factor is positive.
Next and perhaps the most important factor are SSTs. Hurricanes feed off the energy content of warm ocean waters and convert that energy into wind and rain.
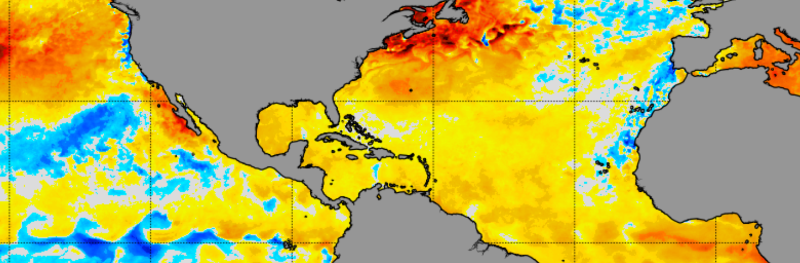
Sea surface temperature anomalies as of August 14, 2021. Source: NOAA
The NOAA chart above displays the difference between the sea surface temperature measured for August 14th of this year and the long term average temperature for that date at the same location. White indicates the temperature is very near the average. Warmer than average locations are shown in yellow, shading through orange to deep red as the anomaly increases. Cooler than average sea surface temperatures are shown in shades of blue.
We can easily see the SSTs in the Gulf of Mexico, the Caribbean and the tropical Atlantic are above average almost everywhere. This is a plus for hurricane formation.
Note also the very warm (red) areas along the northeast coast of the US. Should a storm move up the coast, the much warmer than normal ocean temperatures will keep that storm stronger for longer. The risk of a storm along the east coast and the risk of a major hurricane are therefore increased.
With both SSTs and the MJO in patterns that favor more hurricanes and more intense storms, the third piece is La Niña.
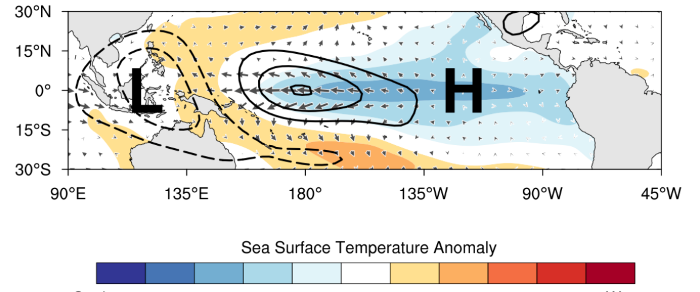
La Niña sea surface temperature and pressure anomalies. Source NOAA
The typical Pacific region temperature and pressure patterns that signal La Niña are shown in the figure above. When La Nina occurs the SSTs in the mid-Pacific are colder than normal. A characteristic of the La Niña weather pattern is decreased wind shear in the Atlantic and Gulf of Mexico, which favors hurricane formation.
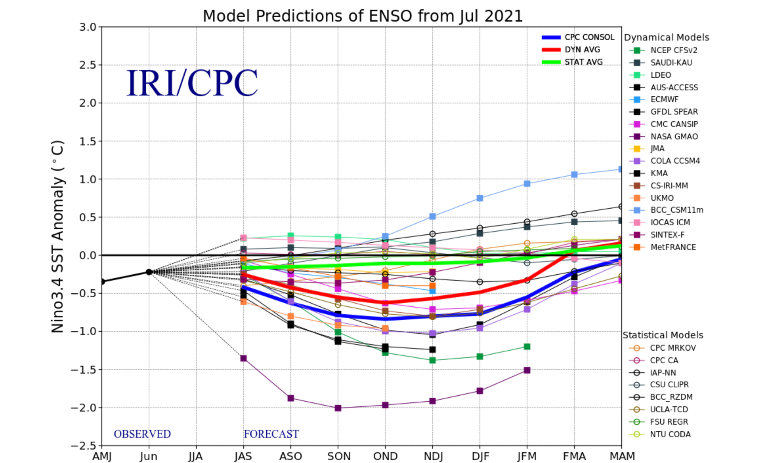
Graph showing current model predictions for mid-Pacific sea surface temperatures Source: International Research Institute for Climate and Society, Columbia University
Recent data from NOAA’s Climate Prediction Center (CPC) models, shown in wide blue line in the graphic above, indicate that the mid-Pacific Ocean is forecast to be increasingly cool in the coming months. If this happens, a La Niña event will be underway. (Note that the graph shows predicted temperature anomalies for rolling three month periods along the x-axis.)
You can see the temperatures in June, July and August are expected to cool further through August, September and October. The wide blue and red lines show the average for the CPC models and an ensemble of models form other institutions, respectively. The main takeaway is that a La Niña event is about to happen during peak hurricane season as I suggested in the April 15 initial hurricane season forecast.
With all 3 major indicators flashing red at this time, the original forecast of 20 named storms, up to 10 hurricanes and 3 to 5 major hurricanes seems to be on the mark.
One final caution. May 2021 was a dry month in Florida. There is a high correlation between dry months in May and major hurricanes in South Florida during peak season. In 1992 Hurricane Andrew, a Category 5, demolished parts of South Florida after a very dry May and during a below normal hurricane season. With a very active peak hurricane season in the offing, this should be extra diligent time for South Floridians.
For the Suncoast of Florida, we will likely see more visits by nature’s most destructive storms. In the world’s steadily warming climate, extreme weather events are becoming more frequent. While early season storms have been weak so far this year, that trend will likely be broken by a series of stronger storms and hurricanes in the weeks and months ahead. Check our website often for updates and information that will help keep you safe.