
Title Image: Storm Ciaràn in action. Credit: Tammy Marlar (@tammymarlar)
Hurricane Hilary, Hurricane Otis and Cyclone Ciarán
Setting the Stage
CAC published the article “More Extreme Weather is Inevitable” on August 11, 2023. In that article, we show how climate warming is leading extreme weather events to become more common and ever more severe.
In the ensuing three months, the extraordinary 2023 global warming trend has continued, as shown in the charts below, accompanied by the notable extreme weather events discussed in this post. The two charts are continuously updated by the Climate Change Institute of the University of Maine, based on data from the National Centers for Environmental Prediction.
Daily Sea Surface Temperature Average, World (60ºN-60ºS)
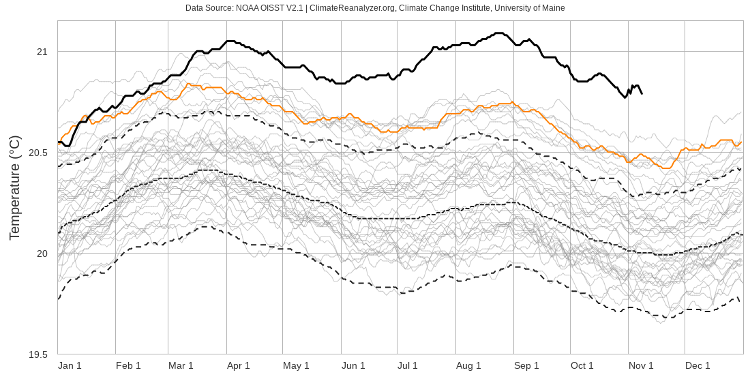
The Sea Surface Temperature Average is based on a combination of NOAA satellite data as well as data from buoys and ships. The satellite data have been available since 1980, and the solid grey, orange and black lines represent the annual record of each year from 1981 through 2023. The 2022 and 2023 temperatures are shown in orange and black, respectively. The data cover the ice-free oceans between 60ºN and 60ºS. The small dashed line represents the average SST for the entire 1981-2023 dataset. The two larger dashed lines to either side of the average line indicate the statistical “2 sigma” range of data—in a stable or “normal” climate we would expect 95% of the data lie between those two lines. As we can see, recent years lie well outside those limits, and 2023 is by far the hottest year since 1980. (A detailed explainer can be found here.)
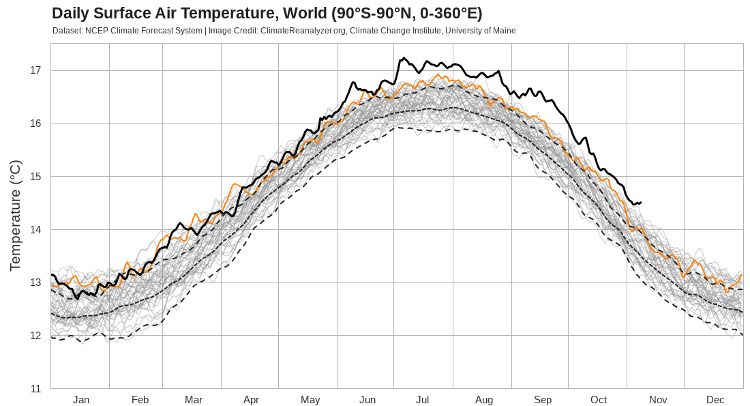
The Surface Air Temperature chart is also based on a combination of daily satellite and surface observations of air temperature at a height of 2m, in this case over the entire globe (90ºN to 90ºS.) This data set covers the period from 1978 through 2023. Again, the orange and black lines represent 20222 and 2023, respectively. Once again we can see that 2023 is logging day after day of record temperatures. (A detailed explainer of the chart can be found here.)
According to the World Meteorological Organization, October crushed the all-time monthly global temperature record, extending 2023’s streak of record land and ocean surface temperatures and diminished sea ice. October was the fifth month in a row of record-high global temperatures. November 2022 through October 2023 constitute the hottest 12 month period on record. The WMO further states “[t]his means that 2023 is almost certain to be the warmest year on record.”
If this wasn’t enough, warming ocean temperatures in the equatorial Pacific are strengthening the current El Niño to the point where scientists at the National Center for Atmospheric Research suggest that it may become a “Super El Niño.” These events are rare—only three Super El Niños have been recorded since 1950.
As we know, basic physics tells us that warm oceans pump more moisture and heat energy into the atmosphere, and warmer air can hold more moisture. Given 2023’s extreme global atmospheric and oceanic temperatures, we expect more frequent, more severe and wetter storms as a result, and this year did not disappoint, with above-normal tropical cyclone formation in the Atlantic, Pacific and Indian oceans.
From mid-August to the first week of November, three of these storms dramatically demonstrated the impact of climate change on severe weather events. These storms—Hurricane Hilary, Hurricane Otis, and Extratropical Cyclone Ciarán—were not “caused” by climate change, but our changed climate enabled their catastrophic impact.
Hurricane Hilary
Beginning as a mid-August hurricane off the coast of Mexico, Hilary became the first tropical storm to hit Southern California in 84 years. Even after weakening to a Tropical Storm, Hilary broke rainfall records across the Western US.
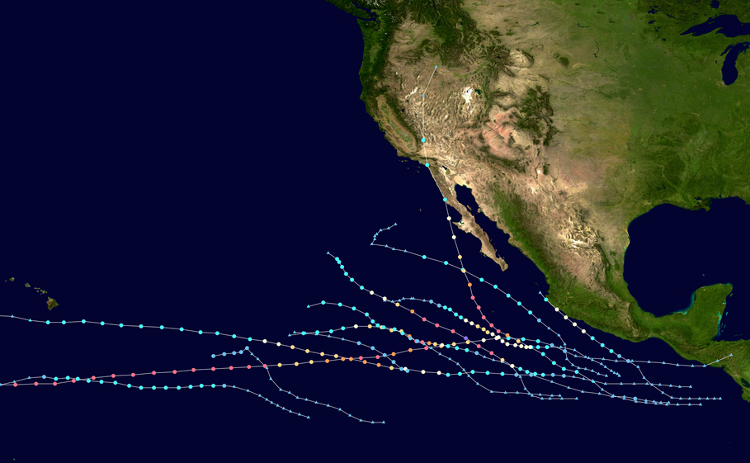
2023 Eastern Pacific hurricane tracks (as of late September) Image Credit: NOAA
Eastern Pacific hurricanes in the Northern Hemisphere typically form in the warm waters off the coast of Mexico and Central America and are steered westward by the prevailing east-to-west flow of the trade winds. Hilary formed off the southern coasts of Mexico, Guatemala and El Salvador on August 14th in ideal conditions for hurricane formation: warm water (30ºC), plenty of atmospheric moisture, and very little wind shear. Hilary became a Category 1 hurricane early on August 17th.
Hurricane Hilary is notable for two things: its rapid intensification, and its northward path into the southwestern US.
Rapid intensification of a hurricane is defined as an increase in maximum sustained winds of at least 35 mph in a 24 hour period. Hilary accelerated from an 80 mph Category 1 to a 143 mph Category 4 in just 18 hours. Warming oceans and plenty of moisture in the atmosphere are the climate warming impacts that fuel rapid intensification.
Hilary’s path was constrained by a developing low pressure region offshore which deflected Hilary northward, along the coast of Baja California.
The combination of rapid intensification and a northward path prompted the National Hurricane Center (NHC) to issue its first ever tropical storm watch for parts of southern California. The weakening from hurricane to tropical storm was a consequence of Hilary’s path over the cold waters off the coasts of Baja and southern California.
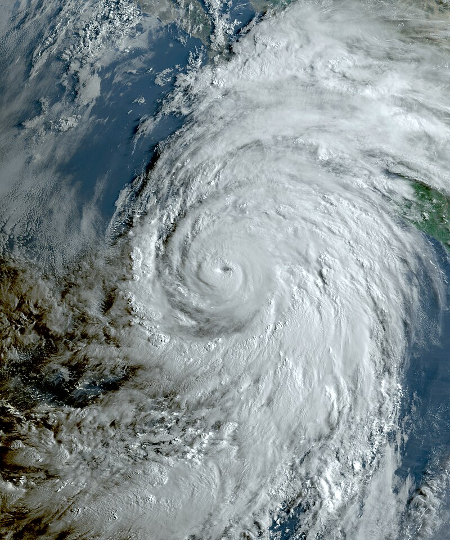
Hurricane Hilary prior to landfall: Category 4 Image Credit: NOAA
Hilary’s Impact
Aside from rapid intensification, the other characteristic of Hilary typical of our warmer, wetter climate is its prodigious rainfall. Even after its trip up the Baja coast, Hilary still carried enough moisture to set new rainfall records across the Western US:
- downtown Los Angeles and San Diego both recorded the wettest single summer day on record. Palm Springs also set a single summer day record.
- rainfall at Furnace Creek in Death Valley set an all-time single-day record of 2.2 inches. The annual average rainfall for Death Valley is only 2.15 inches.
- total rainfall records for tropical cyclones (or their remnants) were broken in Idaho, Montana, Nevada and Oregon. At 9.2 inches, the new Nevada record is more than double the previous record.

Badwater Basin, Death Valley National Park, Nov. 7, 2023. The basin, 282 feet below sea level, is normally a bone-dry salt flat. Rainfall from Hilary not only created the lake, but also heavily damaged hundreds of miles of roads within the park, most of which remain closed months later. Image Credit: Stu Waterman, CAC
Heavy rainfall from Tropical Storm Hilary created widespread flooding, mudslides and property damage. Catastrophe modeler Karen Clark & Company estimates that insurance losses related to Hilary across the Western US will reach $600 million.
Hurricane Otis
Hurricane Otis made landfall early Wednesday, October 25th, near Acapulco, on Mexico’s southern Pacific coast, as a Category 5 hurricane with sustained winds of 165 mph. Otis became the strongest hurricane ever to make landfall on the Pacific coast of Mexico, and the ninth Category 5 storm recorded anywhere in the world in 2023, so far.
As a consequence of the Easterly trade winds tending to guide tropical storms westward, away from Mexico’s Pacific coast, a major storm making landfall is relatively rare. On average, four hurricanes can be expected to make landfall on the Mexican Pacific coast in any given three year period. In 2023, three hurricanes made landfall in October alone!
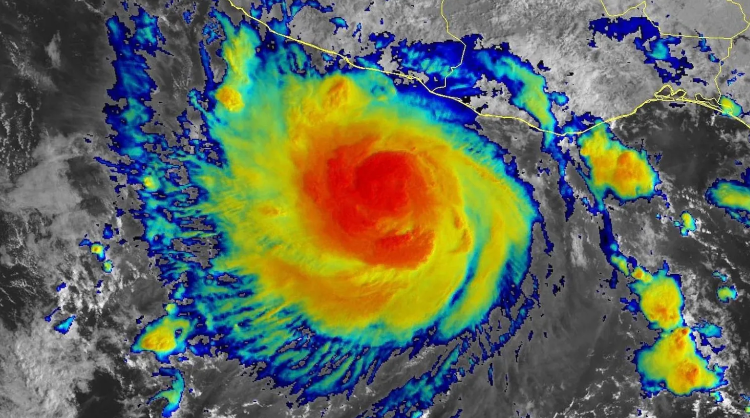
Hurricane Otis nearing the coast of Mexico on October 24, 2023 Image Credit: NOAA
The Evolution of Hurricane Otis
Otis formed roughly 155 miles south-southeast of Acapulco as a relatively innocuous tropical storm. About 24 hours before its estimated landfall, the NOAA National Hurricane Center (NHC) was predicting Otis would make landfall as a Category 1 storm, with winds of about 70 mph.
However, similar conditions to those that sparked rapid intensification of Hurricane Hilary would make nonsense of the forecast:
- a moist environment, relative humidity approximately 70%
- low to moderate wind shear
- very warm ocean waters – 3o to 31ºC (86-88ºF), well above the 1991-2020 average. (Due in part to the current El Niño.)
- hot weather – Mexico had just experienced the warmest September on record
- a compact storm – Otis was only about 30 miles wide, and small storms react quickly to changes in their environment.
As a result, Otis experienced “explosive intensification,” going from a 55 mph tropical storm to a Category 5 hurricane with sustained winds of 165 mph—in just 24 hours! Intensifying 110 mph in 24 hours ranks Otis as the second fastest intensifying storm ever recorded. Recall that an increase of only 35 mph in 24 hours is the threshold for rapid intensification!
Hurricane forecasters, hampered by a lack of data, were stunned by Otis’ rapid development. The text below is an excerpt of an NHC bulletin issued a few hours before Otis hit Acapulco.
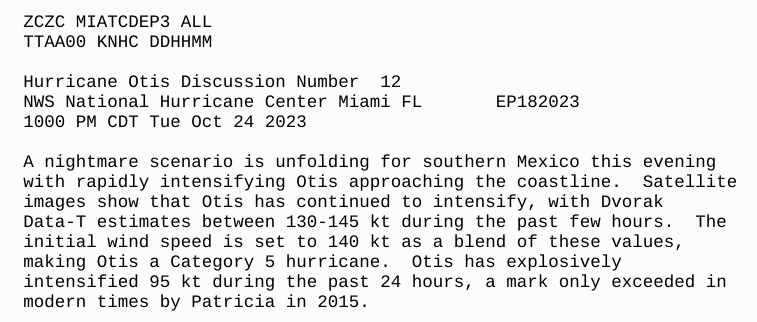
Before Otis, this part of the Mexican coast had never experienced a storm stronger than Category 1. Then Category 5 Otis made a direct hit on Acapulco, a city of a million people, with its most heavily developed areas exposed to the worst case scenario—the more powerful right-front of the advancing hurricane’s counter-clockwise winds. It’s possible that Acapulco has set “a record for the largest number of people ever to experience the eyewall of a Cat 5 storm.”
Otis’ Impacts
Unlike many hurricanes, where the most damage is done by storm surge and inland flooding, wind appears to have caused the most destruction by Otis. Because the storm was small and developed so quickly, there was little opportunity to develop a significant storm surge. In addition, most of Acapulco is well above sea level, and the near-shore waters deepen quickly—also not conditions conducive to storm surge.
Nonetheless, the direct hit by a Category 5 storm with very little warning had catastrophic consequences. At least 48 people lost their lives, with others still missing. The city experienced extensive damage to buildings and structures, fallen trees, severe flooding, and mudslides in the surrounding hills. More than a hundred hospitals and clinics were damaged. The local power and communications grid was crippled, with more than 10,000 utility poles destroyed, and electrical substations and a power plant heavily damaged. International reinsurance broker Gallagher Re reportedly estimates that the total economic damages from Hurricane Otis are on the order of $10 billion US.
Not only did Otis deliver sustained strong winds, but strong gusts were even more destructive. A National Tidal Service weather station near Acapulco measured a 205 mph wind gust. If confirmed, it would be one of the top ten wind gusts measured anywhere.
The NASA images below show the Acapulco area before and after Hurricane Otis.
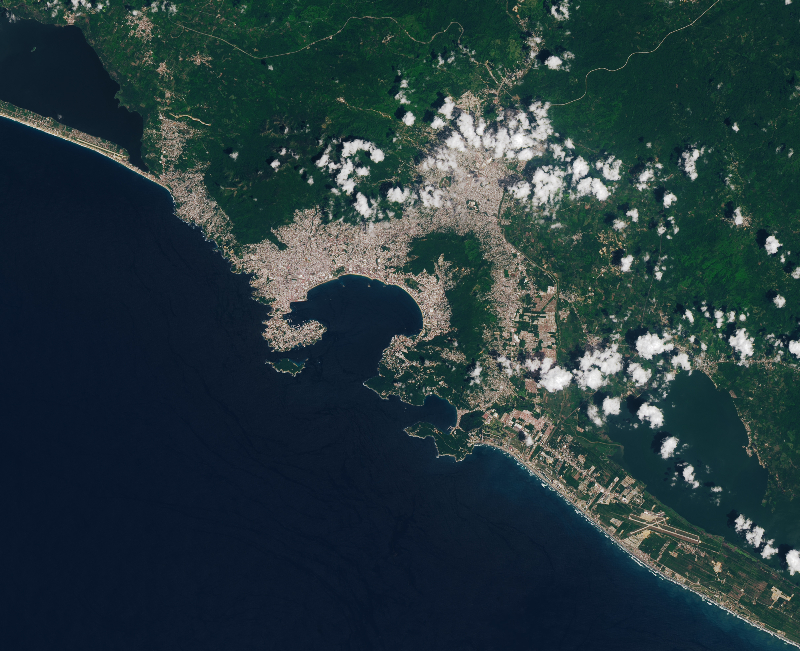
Acapulco before Hurricane Otis Image Credit: NASA
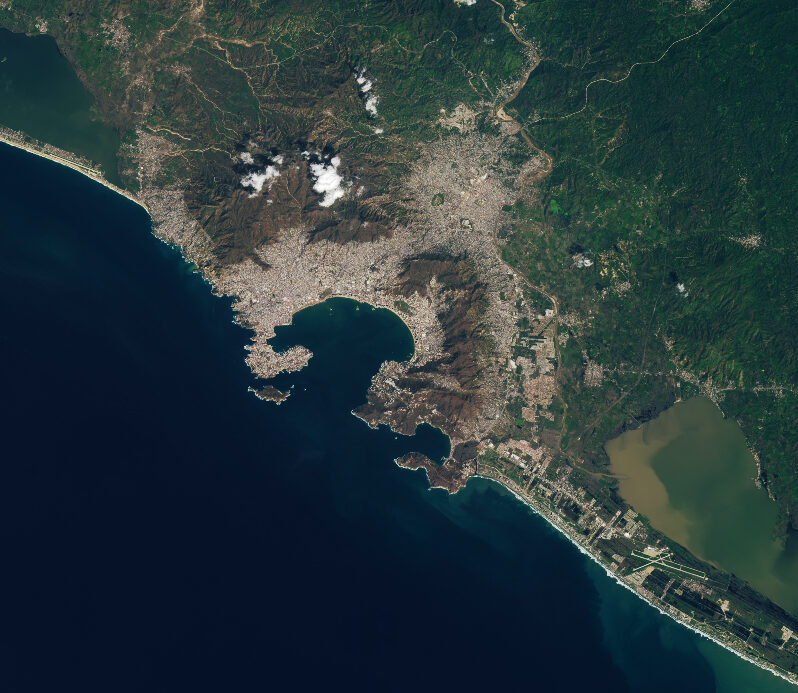
Acapulco after Hurricane Otis. Note the barren hillsides (brown areas) stripped of trees and vegetation. Extensive sediment discharge from flash flooding is visible in the lagoons north and south of the city Image Credit: NASA
Many high-rise buildings and hotels were not designed to withstand a hurricane as extreme as Otis.
Before & after: This brand new $130 million luxury high-rise in Acapulco, Mexico has been severely damaged by Hurricane Otis. pic.twitter.com/X2PVzxrTIO
— Nahel Belgherze (@WxNB_) October 26, 2023
Cyclone Ciarán
While countries in the south of the Northern Hemisphere bid goodbye to the 2023 hurricane season, Europe is bracing for its winter storm season. Cyclone Ciarán, one of the earliest storms of the 2023-2024 storm season, swept through the UK and Europe in early November.
Ciarán made landfall in Southwest England and the Atlantic coast of France on November 1, with heavy rain and winds up to 108 mph. The destructive storm killed at least 21 people and left millions without power as strong winds and falling trees downed powerlines. Heavy rain caused widespread flooding across western Europe.

Storm surge driven by Cyclone Ciarán pounds the coast of Cornwall at Porthleven Image Credit: Stuart Cornell
Storm Ciarán was a very strong Extratropical Cyclone. (Cyclones are storms that have winds spiraling around a central low pressure.) As the name suggests, they form outside the warm tropics. Extratropical Cyclones (ETCs) have cold air at their core, and are fueled by the energy released when cold and warm air masses interact. ETCs have one or more warm or cold fronts associated with the storm, and can form over land or ocean. The Nor’easters that plague the northeastern US are examples of ocean-forming ETCs. Severe ETCs, like Ciarán, can be as destructive as a Category 1 hurricane.
Ciarán formed in the Atlantic, ahead of a strong cold front that moved eastward across the eastern US toward the Atlantic, where a low pressure zone formed along the front, east of New England. The developing storm strengthened over warm waters, beneath the flow of a powerful jet stream. This jet stream ran west-to-east, at an altitude of about 30,000 feet, with wind speeds up to 200 mph. It propelled Ciarán across the Atlantic in just a couple of days.
Incoming Storm Ciarán…
A violent wind storm is brewing in the open waters of the Atlantic right now.
Ciarán unfortunately reaches peak intensity upon arrival on European shores with severe weather warnings issued.
THREAD pic.twitter.com/MeZTF3ZJZV
— Scott Duncan (@ScottDuncanWX) October 31, 2023
The combination of a powerful jet stream, a low pressure area along a cold front, and the record-warm waters of the North Atlantic formed an ideal scenario for rapid intensification. As Ciarán moved towards the coast of England, the low pressure at the center of the storm plummeted to a record low of 953.3 millibars over England, the lowest pressure recorded since 1916. The rate at which the central pressure dropped was exceptionally rapid—much faster than 24 millibars in 24 hours, classifying Ciaràn as a “bomb cyclone.”
#StormCiarán from formation near the Northeastern US coast to explosive cyclogenesis over Europe 🌀 pic.twitter.com/xwRXS48BzS
— Zoom Earth (@zoom_earth) November 2, 2023
Ciarán’s Impact
Storm Ciarán’s hurricane-force winds and torrential rains swept across southern England, France and into Italy. Meteo France, the French meteorological agency said, “Storm Ciarán should rank among the [top] forty major storms since 1980.”
Although Ciarán’s winds were destructive, it seems likely that inland flooding caused by the intense rainfall did the most damage. As an example, within two days after landfall much of Italy’s Tuscany region was inundated, with the BBC reporting that 7.8 inches of rain fell in Montemurlo, about 25 miles north of Florence.
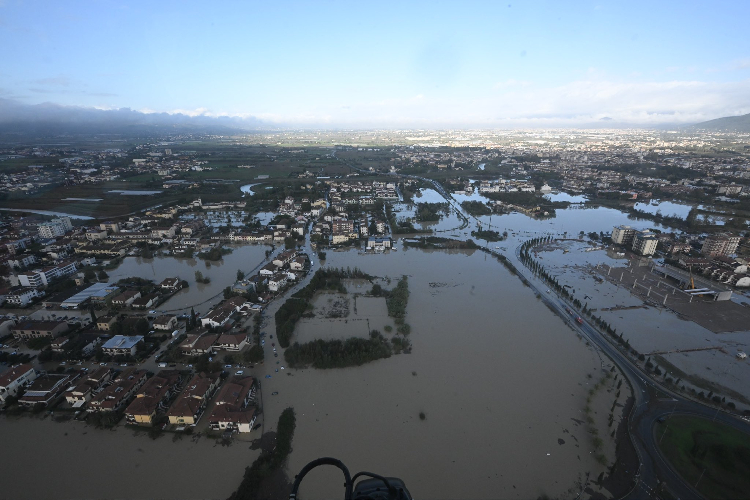
Rainfall from Storm Ciaràn inundated low lying areas in Tuscany Image Credit: Office of the Governor of Tuscany, Eugenio Giani/@EugenioGiani
Overall, Storm Ciarán is estimated to have caused an insurance industry loss of between €800 million and €1.3 billion ($1.4 billion US), according to the extreme event solutions group at Verisk, with the majority of the losses expected in France. However, widespread inland flooding in Tuscany and elsewhere may drive the total much higher.
ETCs and Climate Warming
While the interaction of climate change and hurricanes is well established, we know comparatively little about how ETCs will respond to future warming.
In the case of Ciarán, we will have to wait for in-depth attribution analysis to assess the extent to which climate warming affected the storm. However, we are very likely to find that the storm’s heavy rainfall is related to climate warming. As we know, a warmer atmosphere holds more water vapor, which means when it rains it really rains. We also know that rising sea levels will make coastal storm surges higher and more damaging.
The link between ETC winds and climate change is less clear, partly because of a scarcity of data. Dr. Michael Byrne, University of St. Andrews, sums it up: “There is some evidence suggesting storms like Ciarán will become windier as climate warms, but the jury is out.”
Nonetheless, research suggests that extreme ETCs combining high winds and heavy rainfall, like Ciarán, will happen more often over the UK and western Europe in future.
What’s Next?
These and other recent storms show that, by and large, we have not yet adapted to the changing climate. Limiting anthropogenic climate warming would mitigate risks from extreme weather. Unfortunately, current national pledges to reduce greenhouse gas emissions commit the world to more than double current warming, and thus to more intense flooding and more storm damage. Countries need to recognize that we have created a climate crisis, and act accordingly, not only cutting emissions but building more resilient infrastructure adapted to our increasingly dangerous climate.