
Derna, Libya – before the September 2023 flood
Rising temperatures are driving extreme rainfall worldwide
Earlier this year, the Climate Adaptation Center’s 2023 Florida Climate Conference focused on a new topic—”Climate Warming and the Triple Threat of Water.” (You can view the full conference here.) The “Triple Threat” refers to the three interconnected threats of sea level rise, storm surge coastal flooding and inland flooding from intense rainfall.
Well, the CAC conference proved to be a forerunner of things to come!
The months following the conference placed 2023 front and center in the record books as a year of unprecedented warming, extreme rainfall events and catastrophic flooding around the world.
The Link Between Heat and Rainfall
As we’ve mentioned in previous posts, warmer air can hold more moisture—roughly 7% more for every additional Celsius degree. The relationship between changing temperature and atmospheric moisture content is described by the Clausius-Clapeyron equation, developed during the mid-19th century by Émile Clapeyron, a French engineer/physicist and a German physicist, Rudolf Clausius.
The “7% per degree” approximation sounds straightforward enough—climate warming of 2ºC means the atmosphere can hold 14% more moisture than before, a 3ºC warmer atmosphere can hold 21% more, and so on. That straightforward progression is called “CC scaling.” Obviously, CC scaling will only hold true if there is sufficient moisture available—over the ocean for example. The “atmospheric rivers” that dump prodigious amounts of winter rainfall on California are an example of the impact of CC scaling, where all the water vapor sourced from the warm Pacific ocean is condensed to rainfall as the river rises over land into colder air.
Things are more complex for “convective” storms, where a rapidly rising column of air draws in air from the surrounding atmosphere. (Think: thunderstorms, tropical storms, and hurricanes.) These relatively localized, intense storms pull in more water vapor from the surrounding atmosphere, concentrating it into heavier rainfall in the storm itself. At the same time, all that condensing water vapor releases energy, supercharging the storm and further increasing its ability to concentrate moisture. This dynamic process of “super-CC scaling” in tropical cyclones and hurricanes can easily double the rate of moisture increase to 14% per degree Celsius.
So, that’s the connection between a warming climate and more intense rainfall. Now let’s look at how that link developed in 2023.
2023 Brings the Heat
The year began as a transition from a three year-long, relatively cool, La Niña Pacific weather pattern, to a gradually developing, warmer El Niño. As late as May, the fledgling El Niño seemed far from a sure thing, and global average temperatures were warming, but gradually. This wasn’t unexpected. El Niño events typically take the better part of the first year to reach their stride before peaking in the winter months, and that seemed to be the evolving pattern in 2023.
Until June.
Globally, on land and in the oceans, June 2023 was the warmest June since records began in 1850. Not surprisingly, El Niño was officially acknowledged in early June.
June 2023 was followed by the warmest July ever recorded—the warmest of any month since 1850. Both land and ocean set new July records, with ocean warming particularly striking.
Not to be outdone, August 2023 continued the trend, becoming the warmest August on record—for both land and ocean. This also marked 2023 as the hottest-ever “meteorological summer” (June 1 through August 31.)
By this point, 2023 became everyone’s candidate for the hottest year on record. But wait, there’s more…
The global average temperature record through September 30, 2023 is shown in the chart below. A product of the European Centre for Medium-Range Weather Forecasts (ECMWF), the chart shows daily global average surface air temperature for every year from 1940 onward.
As an aside – climatologists use standard thirty-year reference periods, specified by the World Meteorological Organization, to create “climate normals” that represent a typical climate to use as a reference for comparison. In this case, the reference period is 1991-2020, and the dashed grey line is the “normal” for the last three decades.
In the chart, the location of the “normal” average towards the upper range of the data is the expected result of steadily increasing climate warming over the last eighty-three years. Similarly, the more recent “hottest” years appear near the top of the data set. The official hottest year on record, 2016, is shown in blue. 2023 is shown in black.
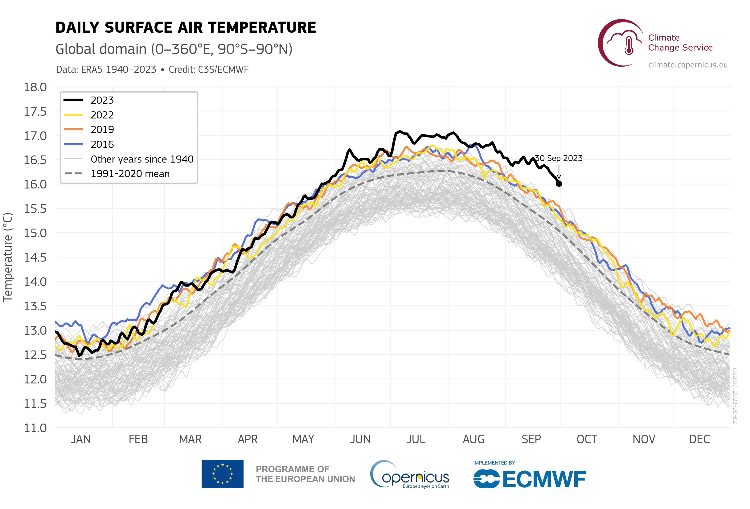
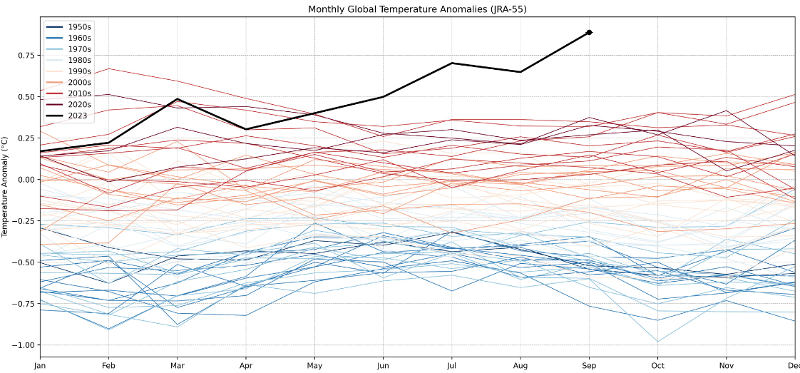
Looking at that chart, you won’t be surprised to hear that September 2023 was the hottest September ever. But what might surprise you is how much hotter it was. The chart below shows temperature anomalies – deviations from the 1991-2020 average, with 2023 in black. Berkeley Earth scientist Zeke Hausfather became instantly internet-famous for his shocked reaction to this chart in a Twitter/X post:
This month was, in my professional opinion as a climate scientist—absolutely gobsmackingly bananas.
Dr. Zeke Hausfather – Twitter/X @hausfath
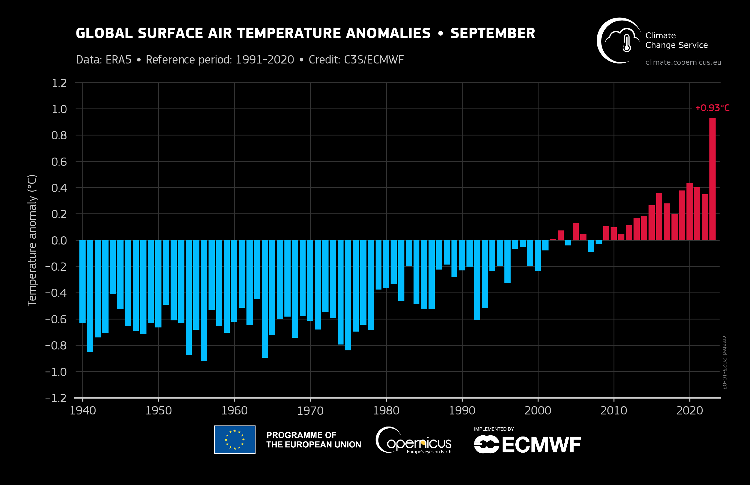
The following ECMWF chart highlights September’s dramatic deviation from the 1991-2020 “normal”—more than 0.5ºC hotter than the previous record September in 2020, and nearly a full degree above the 1991-2020 average for September. On viewing the September ECMWF data set, Dr. Ed Hawkins (University of Reading, creator of the “climate stripes” and someone not easily startled by climate data) simply stated:
Surprising. Astounding. Staggering. Unnerving. Bewildering. Flabbergasting. Disquieting. Gobsmacking. Shocking. Mind boggling.
Ed Hawkins – Twitter/X @ed_hawkins
A few September highlights:
- September 2023 featured the largest warm anomaly of any month since 1940 (the start of the data set.)
- September was around 1.75°C warmer than the September average for 1850-1900, the preindustrial reference period.
- For January to September 2023, the global mean temperature for 2023 to date is 1.40°C higher than the preindustrial average (1850-1900).
- The average sea surface temperature for September over 60°S–60°N reached 20.92°C, the highest on record for September and the second highest across all months, behind August 2023.
And El Niño has yet to reach its peak…
According to Samantha Burgess, Deputy Director of the Copernicus Climate Change Service (C3S): “The unprecedented temperatures for the time of year observed in September – following a record summer – have broken records by an extraordinary amount. This extreme month has pushed 2023 into the dubious honor of first place – on track to be the warmest year and around 1.4°C above preindustrial average temperatures.”
While a single year near the 1.5ºC target climate warming limit is far from a full-fledged climate disaster, it shows how close we have come, and how quickly. The upcoming COP28 UN climate conference should be interesting…
So, 2023 definitely brought the heat, to land and oceans. Now, let’s take a look at how the planet responded.
Extreme Rainfall, Catastrophic Floods
Obviously, there are many factors beyond the Clausius-Clapeyron equation that combine to magnify or minimize atmospheric moisture content and precipitation at any given location. Nonetheless, we can reasonably expect a moisture-laden atmosphere to be prone to extreme precipitation events. That certainly proved to be the case in 2023.
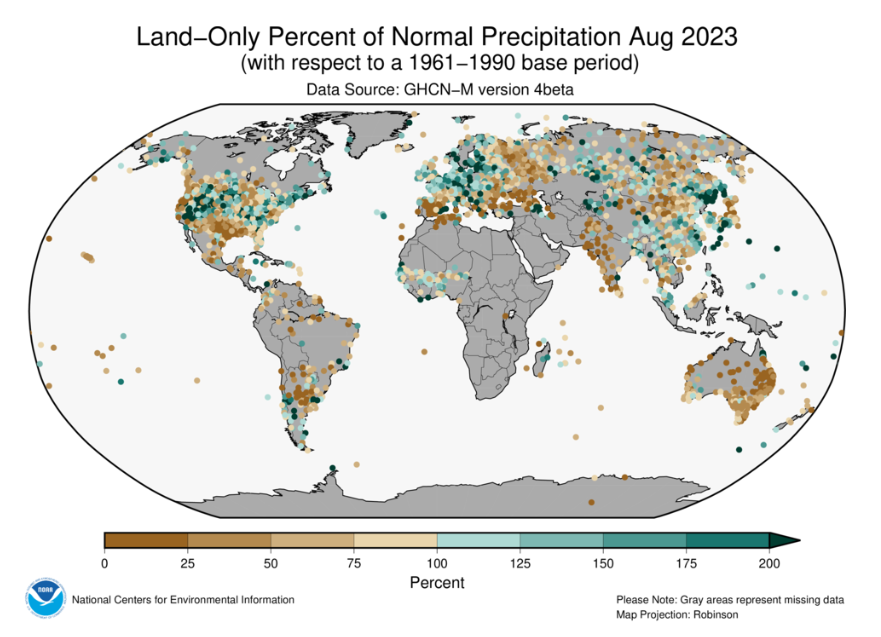
By October, Bloomberg Green reported that cities around the world had logged all-time record rainfall 139 times. The map below shows a staggering number of locations that received exceptional rainfall in August – in many cases more than twice the normal average.
Events reached a crescendo in early September:
- Typhoons Saola and Haikui sliced through Asia within days of each other, ravaging Taiwan, Hong Kong, and parts of southern China. Another storm that hit Hong Kong after Typhoon Saola logged the highest hourly rainfall in the city since records began in 1884.
- In Europe, a rare hurricane-like storm called a “medicane” wreaked havoc in the Mediterranean region. In Greece, Storm Daniel dumped more than a year’s worth of rain in a couple of days, devastating entire towns and killing at least 15 people. Daniel also caused severe flooding in Turkey and Bulgaria, before moving south across the Mediterranean.
- Storm Daniel’s most severe impact occurred when the storm, newly strengthened after crossing the warm Mediterranean, reached the coast of Libya. Torrential rain overwhelmed two dams above the coastal city of Derna, releasing a wall of water that tore through the city, destroying thousands of buildings and killing over 11,000 people
- Deadly flooding in Brazil’s Rio Grande do Sul was the result of receiving a month’s worth of rainfall in a few days
- Nevada’s desert-based Burning Man festival was washed out when the site received twice the average monthly rainfall in just 24 hours.
- In the Northeastern US rainfall from northward-moving tropical storms led to widespread flooding, damaging buildings and infrastructure, including roads. bridges and railways. Vermont received two months worth of rain in just two days. Leominster, Massachusetts logged nearly 10 inches of rain in just six hours.
World Weather Attribution was able to determine the impact of climate change on Storm Daniel, first when it struck Greece and Turkey, and again when it struck Libya. Given our review of 2023’s weather so far, their results will not surprise you:
“For the large region including Greece and parts of Bulgaria and [Turkey], we find that human-induced climate change made an event as extreme as the one observed up to 10 times more likely and up to 40% more intense. An event as extreme as the one observed over Libya has become up to 50 times more likely and up to 50% more intense compared to a 1.2ºC cooler climate.”
News relevant to this post just keeps rolling in, but I’ll bring it to a close with one final event that will serve as a cautionary note going forward—the New York City flood of September 29, 2023.
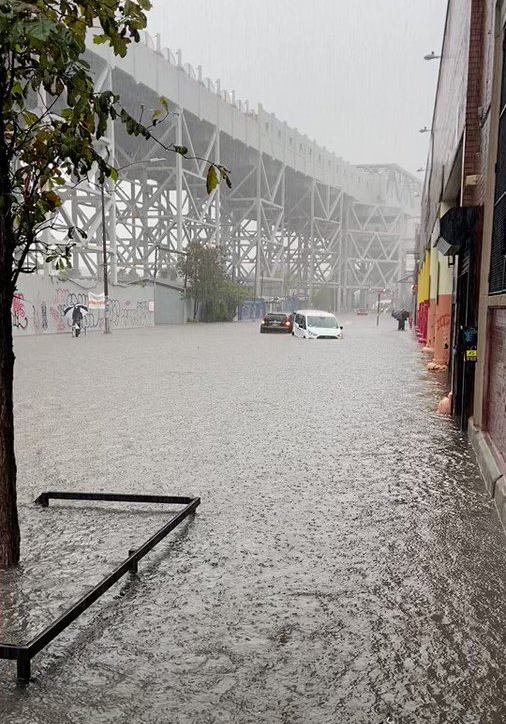
New York City, September 29, 2023. Credit: Guy Walton via Twitter/X – @climateguyw
A comparatively innocuous storm formed when the moisture-laden remnants of Tropical Storm Ophelia offshore met up with a colder weather disturbance approaching from the west. The result was 7 to 8 inches of rain, much of it falling within a few hours in the morning of the 29th. John F. Kennedy International Airport reported a daily rainfall record of more than 8.5 inches.
Storm sewers were rapidly overwhelmed, leading to widespread flooding, and a repeat of many problems experienced during Hurricane Ida in 2021. Fortunately, there were no deaths this time, but despite considerable efforts invested after Ida, the inherent weaknesses of aging infrastructure still remain.
Was this unexpected? Perhaps with a note of frustration, meteorologist Matthew Cappucci had this to say: “[The NYC] precipitation event is right in line with what we’d expect: yet another convective precipitation event with high rainfall rates and extreme totals made more likely by a warmer atmosphere’s capacity to hold moisture.”
As I write this on October 7th, more heavy rain is heading to New York City…