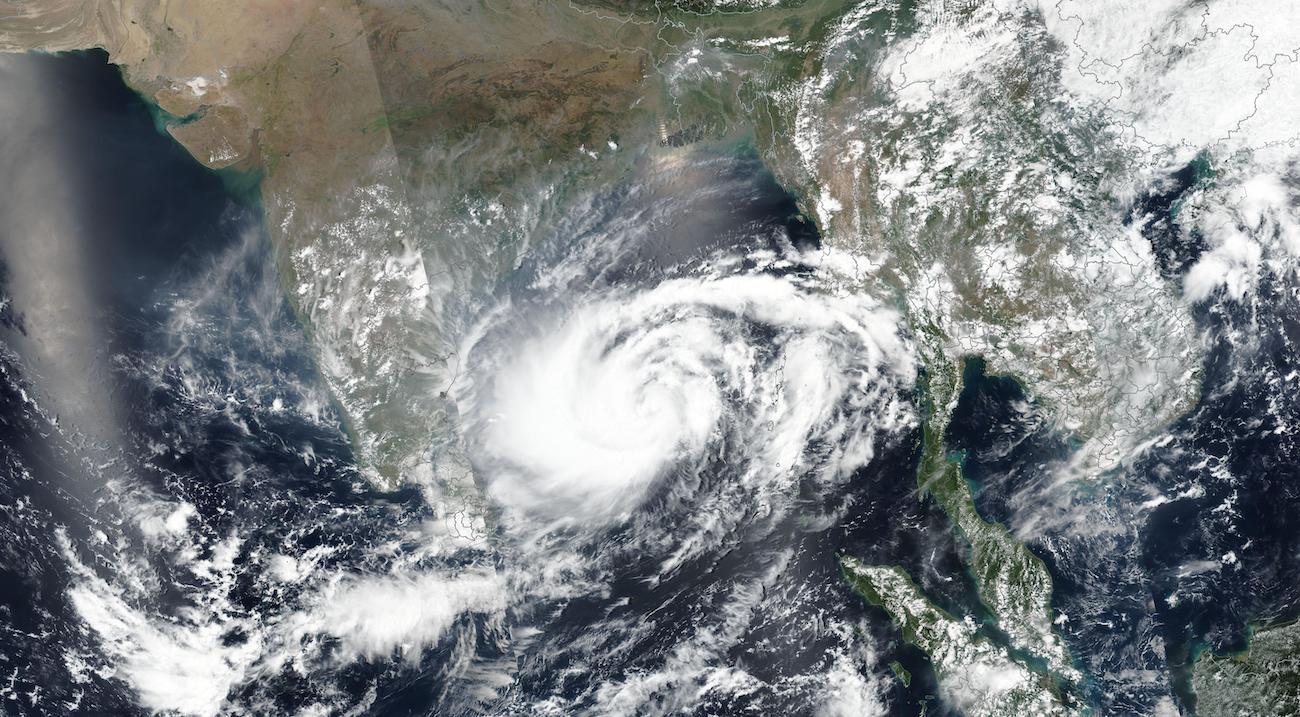
Title image: Tropical Cyclone Mocha (NASA)
Looks Like Another Hot One!
During the past three years, La Niña masked the full effects of climate warming. Nonetheless, 2022 ranked as the fifth warmest year since 1850. In fact, Berkeley Earth reports that the last eight years were the eight warmest years in the instrumental record.
At long last, the “triple dip” La Niña gave up the ghost this past winter. So, as we enter the 2023 hurricane season, let’s take a look at what that meant to our weather so far and what may lie ahead.
In the first part of this two part post we will look at how the absence of La Niña has affected global climate in early 2023. The second part of the post will look ahead to the potential for an El Niño event later this year, and its likely impact on global weather.
2023 – Off to a Hot Start
Globally, March was the second warmest March ever recorded, averaging 1.52ºC (2.74ºF) above the 1850-1900 average. This is just a single month’s record and it doesn’t mean that we have already exceeded the Paris Agreement target limit of an annual average of 1.5ºC, but we’re knocking on the door.
Over the world’s land area, the March average was an eye-opening 2.35°C (4.23°F) above the 1850 to 1900 average. Over the oceans, March was significantly warmer than in the preceding La Niña years. March was the 4th warmest ever recorded in the oceans, at 0.96ºC (1.73°F) above the long term March average.
The warming trend continued through April, with NOAA reporting the 4th warmest April global average, and a near record average for the oceans that month, only 0.01ºC below the 2016 record. April 2023 marked an incredible 530th consecutive month with a temperature average above the 20th century average.
Heatwaves
Not surprisingly, this exceptionally warm weather triggered extreme heat events, and heatwaves plagued Asia, the Mediterranean region, and Western North America.
Southeast Asia, China, India, Bangladesh, Pakistan
The Guardian noted that Asia experienced “the worst April heatwave in Asian history” and extreme temperatures continued into May. Notable events (as of May 12) are listed below.
- Thailand: April 15th set an all-time record of 45.4ºC (114ºF)
- Vietnam: all time record temperatures May 6-7 of 44.2ºC
- Phillipines: May 11th temperature of 37.4ºC was the hottest May day ever, and seond hottest day on record
- Pakistan: on May 12th Dadu recorded a daily high of 47.5ºC (117.5ºF)
- China: record high temperatures were recorded at hundreds of weather stations. A mid-May heatwave in Northern China appeared likely to set a new record.
Spain, Portugal, Algeria, Morocco
World Weather Attribution, a scientific organization that evaluates the link between climate change and extreme weather events, reported that temperatures during a late April heatwave in the Western Mediterranean were up to 20ºC higher than the April normal in many regions—an extreme event even in today’s warmer climate.
- Portugal and Spain broke national April records, with highs of 36.9ºC and 38.8ºC respectively
- Morocco: many new April records were set, with temperatures above 41ºC in Marrakech and other cities
- Algeria: temperatures exceeded 40ºC in multiple locations
World Weather Attribution estimates that this was a 1 in 400 year event, even for today’s warmer climate. To put it another way, that means that the chance of such an event occurring in any given year is roughly 0.25%. Climate warming was estimated to have made the event at least 100 times more likely.
Western North America
At this writing (mid-May) another exceptional North American heatwave is ravaging the Pacific Northwest.
- large areas of Western Canada recorded early May temperatures 10-15ºC above normal
- hot dry weather sparked more than 100 forest fires in northern Alberta, British Columbia and the Yukon. At one point, as many as 30,000 people were evacuated.
- Climate Central reports that the extended forecast indicates record heat is likely for large areas of Washington, Oregon, Northern California, Idaho, Montana, Alberta, British Columbia and the Yukon.
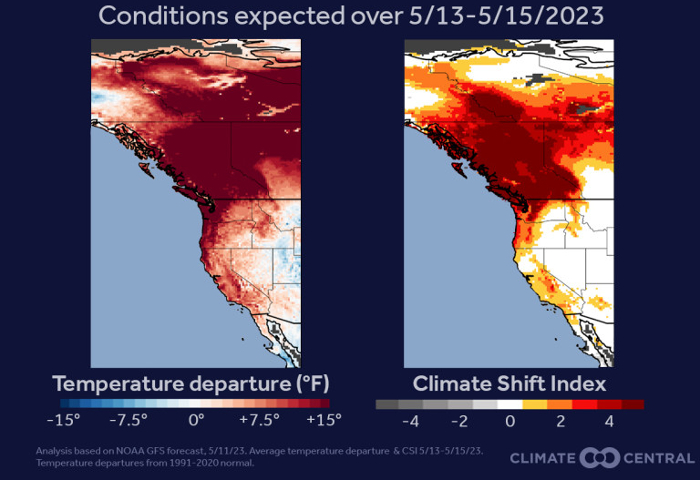
Climate Central map of forecast heatwave May 13-15
Broad areas of the Pacific Northwest expect temperatures at least 15ºF above normal for early May, building to 40ºF above normal as the heat wave develops. Climate Central’s “Climate Shift Index” (shown above in the map at right) estimates that heatwaves of this magnitude, at this time of the year, have been made 2 to 5+ times more likely by climate warming.
The image below shows the NOAA Global Forecast System temperature forecast for May 12th. Note that areas of the Canadian subarctic are forecast to be more than 18ºC (32.4ºF) above the late 20th century average.
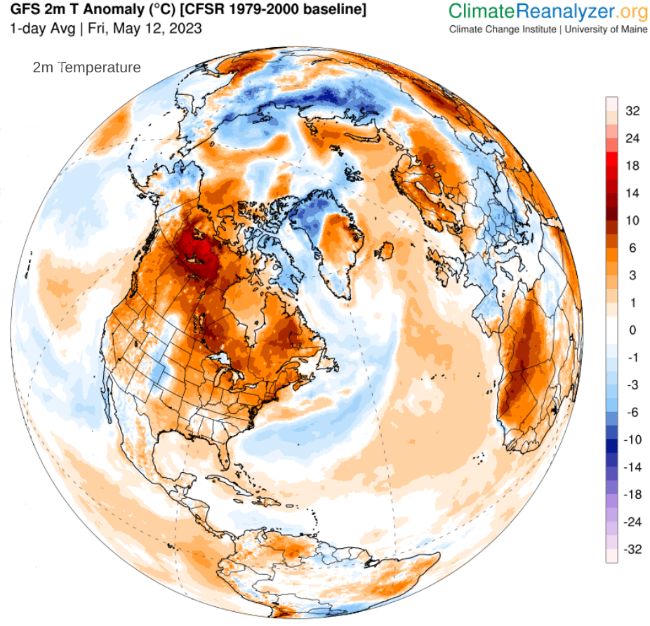 Surface air temperature anomalies. GFS data visualization by the Climate Change Institute, University of Maine
By Saturday, May 13th, more than 12 million people in the Pacific Northwest were under a heat advisory warning. All-time high temperature records were broken across Washington and Oregon, with the National Weather Service/Weather Prediction Center forecasting more records with temperatures 20-30ºF above normal.
The surge in hot weather is driven by a ridge of exceptionally high pressure—a heat dome. Under a heat dome, air slowly sinks, warms and dries out, while clear skies maximize solar heating. The catastrophic Western Canada heatwave in June of 2021 was caused by a heat dome. Unusually this early in the year, a very strong heat dome developed in April and early May of 2023.
This year’s heat dome is shown below, excerpted from a Twitter post by meteorologist Jeff Berardelli. The image is a May 9th forecast for May 14th. The purple area on the map represents record high pressures for the region, clearly showing the heat dome.
Berardelli points out that heat domes of the magnitude of June 2021 and May 2023 are 1 in 1000+ year events – to all intents and puposes, they would be virtually impossible in the historical climate. Climate warming is making these events increasingly likely, to the extent that they may be 1 in ten year events by 2050.
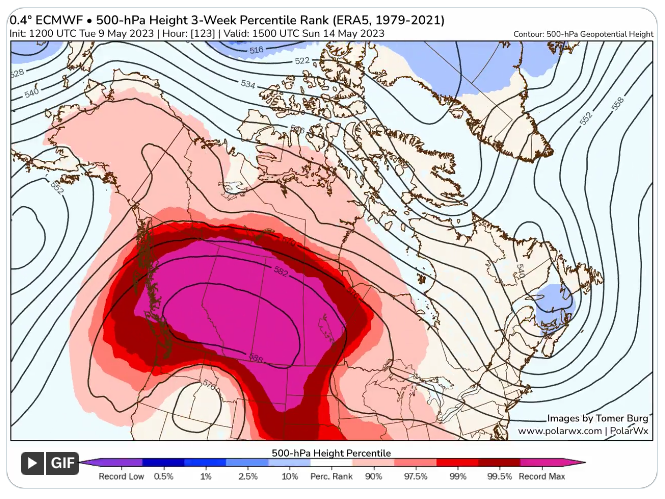 Western Canada heat dome forecast for May 14, 2023 Credit: Jeff Berardelli
This year’s heat dome will likely drive monthly record temperatures across the region. Fortunately, because the unusual event is occurring in cooler conditions than the record summer heatwave of 2021, temperatures should be below all-time record levels.
Warmer Oceans
The world’s oceans are also off to a “hot start” for 2023. In fact, the global average Sear Surface Temperature of 21.1C reported by NOAA for early April is a new world record, beating the previous record of 21C set in 2016, during the 2014-2016 El Niño event. As the graph below shows, we are continuing to set daily records.
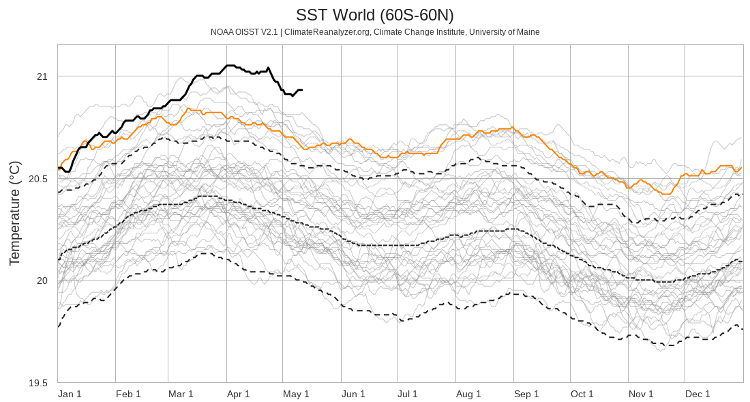 Global daily average Sea Surface Temperature. The solid black line represents 2023 SST through May 11, while the orange line shows the data for 2022. The grey lines show yearly SST data going back to 1981, with the central dashed line showing the 1982-2011 average. Graphic courtesy of the Climate Change Institute, University of Maine
Marine Heatwaves
As is the case in similar circumstances on land, a consequence of high temperatures in the oceans is an onslaught of marine heatwaves. At this writing, worldwide marine heatwave data show strong marine heatwaves in the south Atlantic, around New Zealand, in the Arabian Sea, along the northeast coast of Japan, east of the Philippines, across the central Pacific at about 39ºN, and off the northwest coast of South America.
As we’ve discussed before, the vast majority of heat energy generated by anthropogenic climate change ends up in the oceans. Because of the sheer mass of the oceans, their temperature response to the added energy is slow to accelerate. Nonetheless a comprehensive review article in late 2022 determined that the top 2000 m of the oceans have “significantly warmed” from 1950 through 2019, with the rate of warming more than doubling from the 1960s to the 2010s. The study concludes that ocean warming is irreversible in this century, with the projected heat content in the upper 2000 m more than doubling by 2100.
Climate Impacts
The consequences of ocean heating are widespread: accelerating sea level rise, intensifying extreme rain events, melting sea ice, adding energy to cyclones and changing where they form, and causing more intense marine heatwaves. Broadly speaking, ocean heating is leading to weather systems that are bigger, more intense and longer lasting.
A timely example of a bigger, more intense weather system is Tropical Cyclone Mocha. On May 14th 2023, Mocha made landfall in Myanmar as a Category 4 storm with windspeeds of 155 mph. Just prior to landfall Mocha peaked as a Category 5 storm with 175 mph winds, weakening to Category 4 as it met cooler coastal water, wind shear and drier air. Mocha is the strongest storm ever recorded in the North Indian Ocean.
 Tropical Cyclone Mocha in the Bay of Bengal, May 11, 2023 Image: NASA
On May 13th, the United Nations Satellite Center estimated [PDF] that roughly 2 million people in Myanmar and Bangladesh would be exposed to hurricane force winds when Mocha made landfall.
Looking Ahead
The World Meteorological Organization recently issued their Global Seasonal Climate Update for May, June and July of 2023. The image below shows the seasonal sea surface temperature forecast in terms of the likelihood the forecast temperatures will exceed the 1993-2009 seasonal average.
The report doesn’t beat around the bush in assessing the impact: “As warmer-than-average SSTs are generally predicted over oceanic regions, they contribute to widespread prediction of above-normal temperatures over land areas. Without exception, positive temperature anomalies are expected over all land areas in the Northern and Southern Hemisphere.”
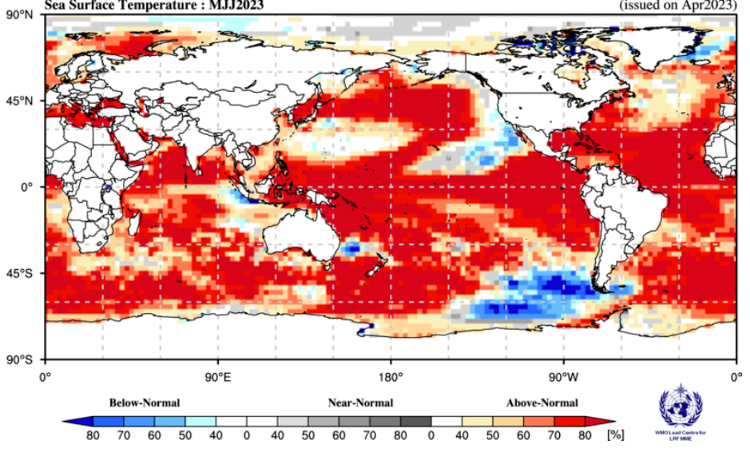 WMO SST forecast for May through July 2023. The dark red areas have a greater than 80% chance of temperatures above the 1993-2009 average. Image courtesy WMO (PDF)
The equatorial Pacific in particular shows a very high probability of higher than average temperatures, which suggests a transition to El Niño conditions may be imminent.
We will discuss the possibility of an El Niño event in 2023 and its impact on global climate in Part 2 of this post. Stay tuned!