It’s Not Just About Hurricanes
When the Climate Adaptation Center’s CEO, Bob Bunting, put together our 2022 Hurricane Forecast one of the factors driving his prediction of another very active hurricane season in the North Atlantic was the potential for a La Niña circulation pattern in the tropical Pacific. Although enhanced Atlantic hurricane development is a spectacular impact of La Niña, its effects are felt year-round, across North America.
What Is It?
The Trade Winds over the Pacific Ocean blow steadily from east to west along the equator. La Niña occurs when the winds are abnormally strong, forcing warm surface water on the eastern side of the Pacific towards Asia, to be replaced by colder water upwelling from below. As a result, La Niña shifts the location of tropical rainfall westward, disrupting atmospheric circulation and ultimately altering the mid-latitude jet streams.
La Niña’s brother, El Niño, happens when the Trade Winds weaken and warm water accumulates along the west coast of the Americas. Together, they form the two phases of the El Niño Southern Oscillation, or ENSO. El Niño events are more common than La Niña, but neither occurs on a regular schedule.
La Niña typically begins in the late summer/early fall (coinciding with peak hurricane season), peaks in the winter, and weakens through the following spring, fading out in the summer. During the winter, when La Niña is strongest, the Pacific jet stream meanders north of its usual path towards the Pacific Northwest. At the same time the stronger Polar jet enters a “wavy” pattern, as shown in the map below.
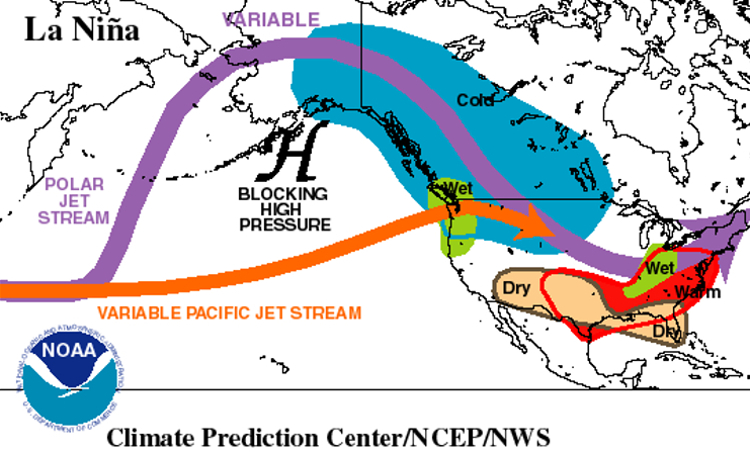
As a result, the Pacific Northwest winter tends to be cooler and wetter, while warmer and drier conditions dominate the southern states, from California to the Carolinas.
La Niña in 2022?
A La Niña event boosted the record-setting 2020 hurricane season. Unusually, it was followed immediately by another La Niña, which contibuted to the very active 2021 hurricane season. The 2021 La Niña has carried on into the spring of 2022, and there are signs that it may survive to develop into another full-blown La Niña by the fall.
When we prepared our initial 2022 Hurricane Forecast, there was only a 50/50 chance that a La Niña event would develop to impact the 2022 hurricane season. However, on May 16th, changing conditions led NOAA to issue a La Niña Advisory [pdf]. All the indicators now show that La Niña is still present and “favored to continue,” with a 58% chance of continuing through late summer, and a 61% chance of strengthening through the fall and early winter.
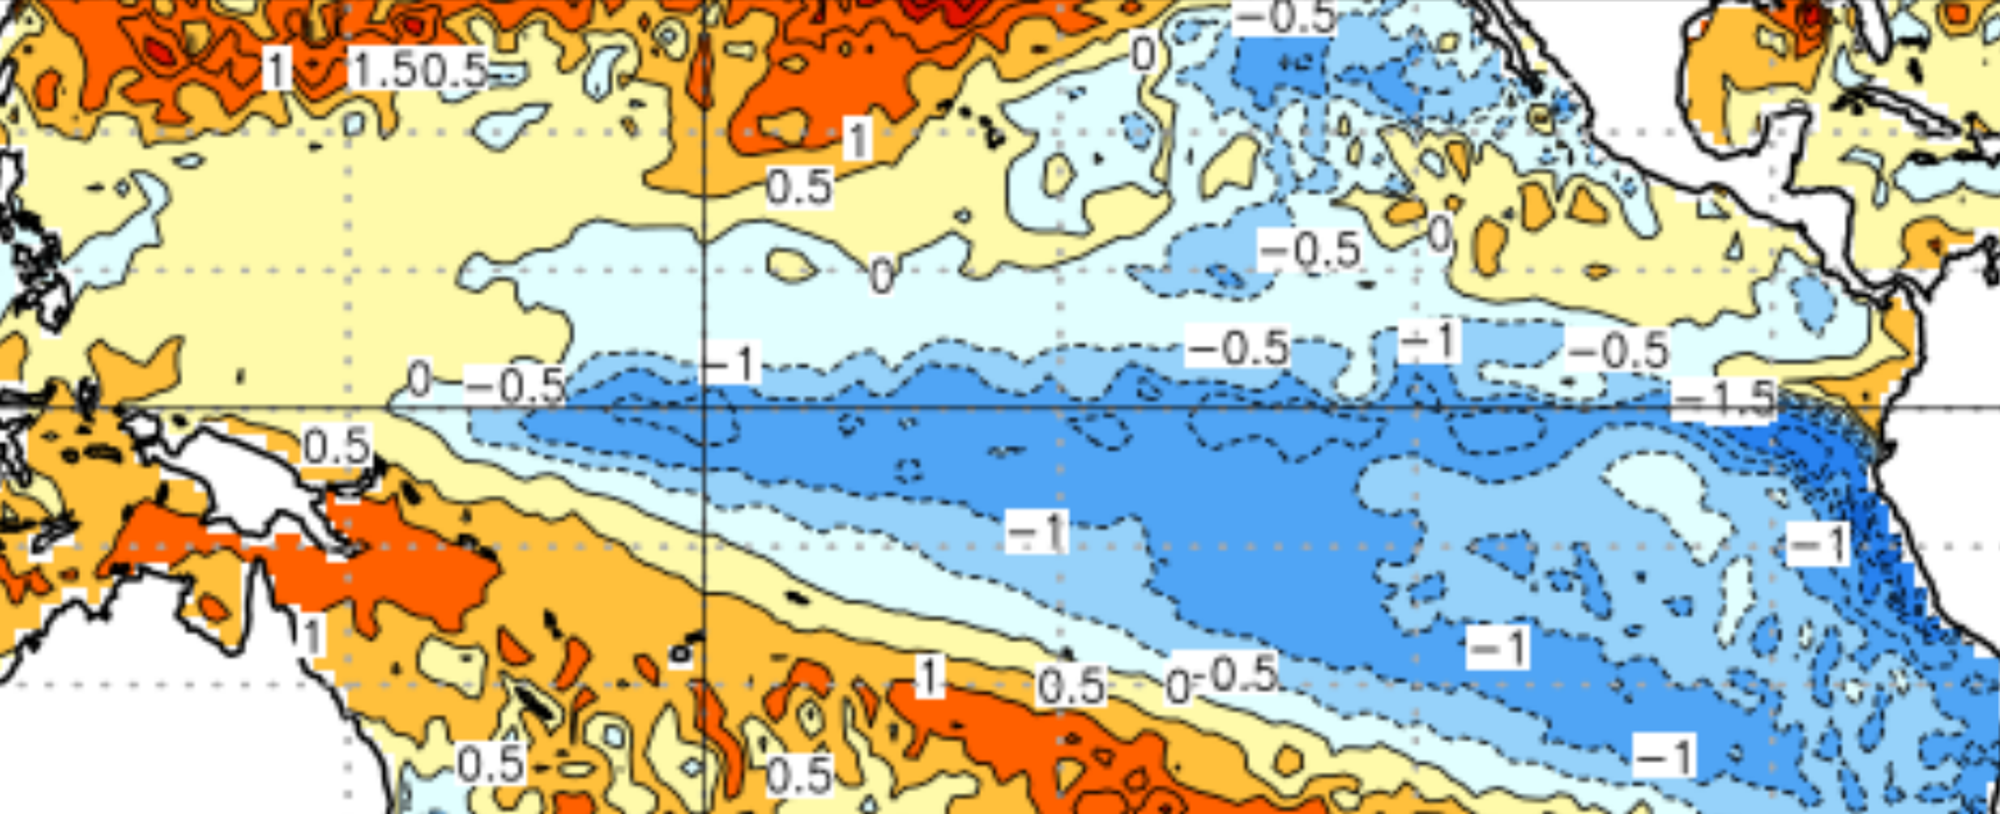
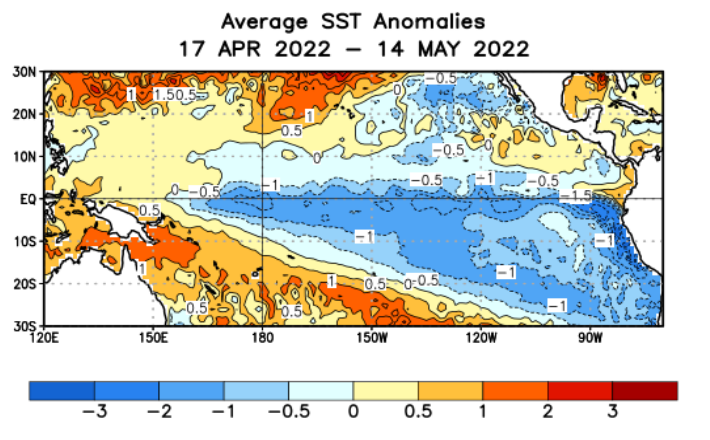
The map below shows late April/early May sea surface temperatures up to 1.5ºC below average over much of the eastern equatorial Pacific — strong support for a continuing La Niña.
La Niñas often occur in consecutive years, as we saw in 2020 and 2021. If current conditions evolve into a third La Niña, it will be a rare “Triple Dip” La Niña — a meteorological three-peat! Since ENSO records began in 1950, we have logged only two Triple Dip La Niñas to date.
Consequences?
As we’ve pointed out, a 2022 La Niña increases the probability of a busy hurricane season. But La Niña’s impact spans the seasons, affecting:
- severe storms, notably tornadoes and hailstorms
- temperature and precipitation patterns, and consequently drought and wildfire weather.
Severe Storms
In general, springtime tornadoes and hailstorms are more frequent during La Niña.
Research shows that ENSO affects tornado and hailstorm frequency by its influence on the path of the jet stream over North America. La Niña induces a wavy pattern in the jet stream, and shifts the jet northward. This concentrates hot, humid air over the south-central and southeastern states and the resulting north-south temperature gradient encourages tornado and hailstorm formation.
Tornado formation generally requires an unstable air mass (in this case, warm and humid air near the surface, with cool dry air above) and vertical wind shear (different wind directions and/or speeds at different altitudes). In a La Niña year, these requirements are frequently met in the Gulf Coast states in the spring, in the Plains states in May and June, and the upper Midwest in early summer. (These are the favorable circumstances for tornado formation, but tornadoes and hailstorms can occur anytime.)
March showed the power of a strong La Niña winter, with 2022 setting an all-time record of 218 total confirmed tornadoes in the month of March. The previous March record of 192 was set in 2017, while March 2021 accounted for 191.
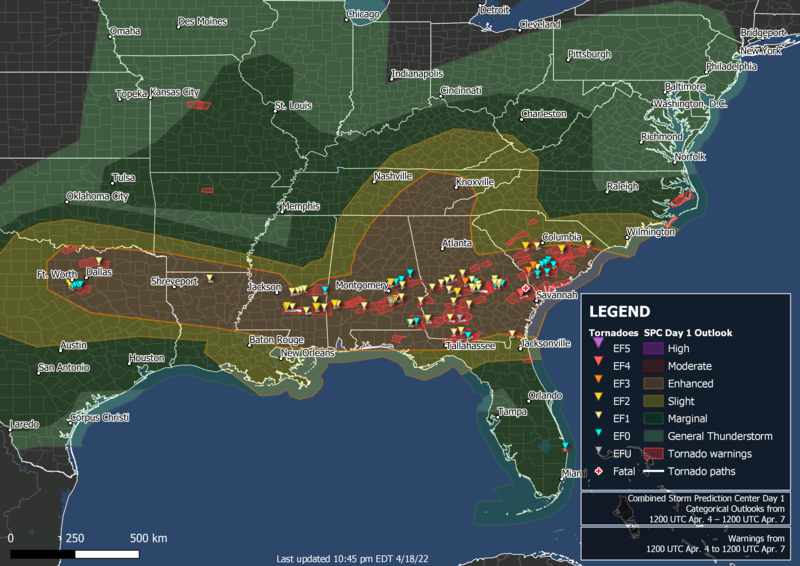
April picked up where March left off, with a tornado event in the Southeast April 4-5 yielding 86 reported tornadoes. An EF4 tornado in Georgia logged winds of 185 mph (298 kph), while several locations reported hail 7 cm (2.75 in) in diameter. The map below shows the extent of the outbreak. (Map and data courtesy of Wikimedia.)
Temperature and Precipitation Trends
So far this year, California had its 6th warmest January through April period on record. Regional U.S. temperatures are riding on global temperature trends, of course. The average global surface temperature (land and sea) for January through April this year tied with 2010 as the fifth warmest January through April period in the 143 year global record.
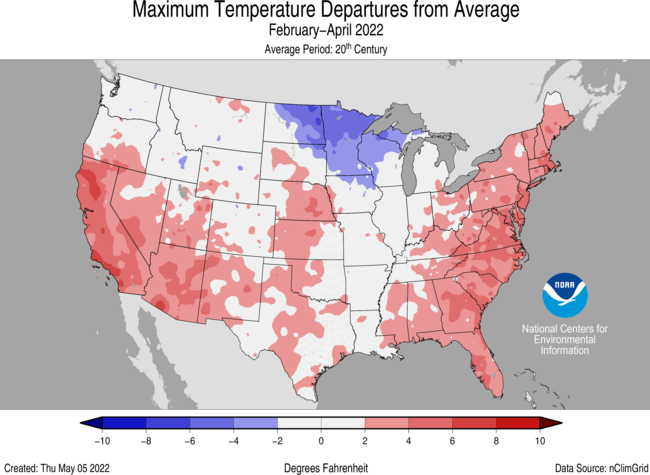
During La Niña, the Pacific jet stream often wanders into the North Pacific, no longer acting as a reliable conduit of moisture and storms across the southern U.S. As a result, the southern states—from California to the Carolinas—tend to be warmer and drier than average, with the southwestern states particularly hot and dry. The following map shows the average daily maximum temperature relative to the long term average. California and the desert southwest, along with the east coast, are experiencing daily highs well above average. At the same time, the northern and central states remain at or below average due to frequent cold air outbreaks behind the wavy jet stream typical of La Niña winters.
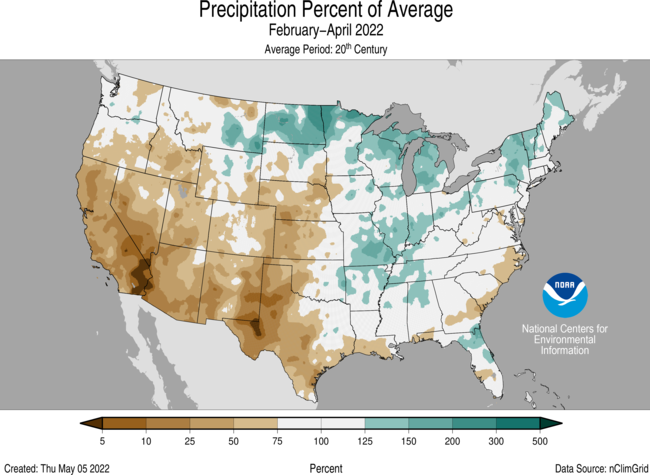
La Niña’s northward-shifted jet stream is associated with diminished precipitation over large areas of the western and southern U.S. The map below shows 2022 precipitation to date well below average for California and the Southwest, west Texas, Kansas and Nebraska. Portions of the Southwest and west Texas received no precipitation in April.
California has been particularly hard hit, with NOAA reporting that precipitation for January through April was the lowest since records began in 1895. Without the jet stream driving moisture-laden storms onto the west coast, California’s winter wet season didn’t show up. Worse yet, from late spring through early fall, the jet stream moves north, leaving much of the state dry. At higher elevations, the La Niña winter starved California’s high country of the snowfall that provides much of the state’s water when it melts during the dry season.
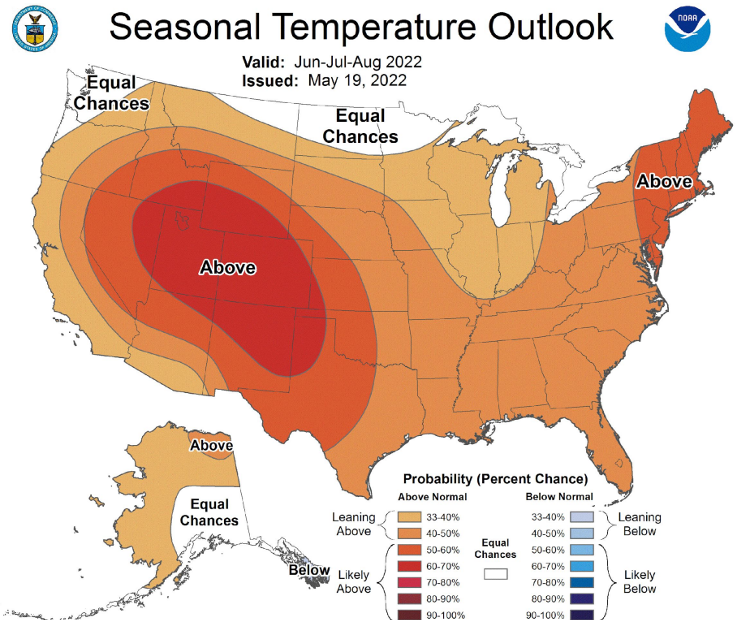
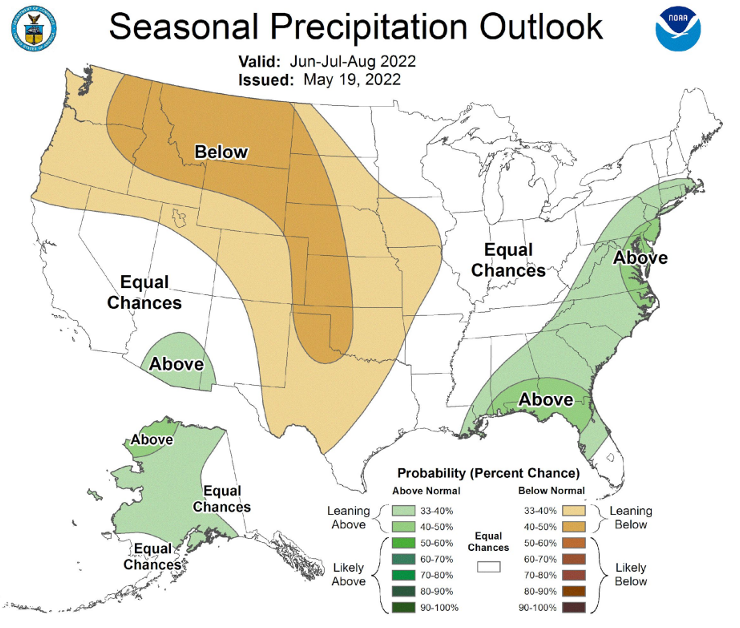
Looking forward in 2022, La Niña is forecast to remain in place, although weakening in the summer months, before likely strengthening into a third consecutive La Niña winter. Regardless of what happens to La Niña next winter, June through August will be hot and dry for much of the country.
Temperatures will be solidly above normal across the country, with the Southwest hit particularly hard.
The precipitation outlook map is somewhat deceptive. With the Southwest and California already bone dry in a normal summer, there is little chance of even less precipitation. However, the 2022 June through August forecast for the rest of the western U.S. does suggest lower precipitation in what is already a relatively dry season.
Drought and Wildfires
As we’ve written before, droughts, wildfires, and climate warming go hand in hand. In the case of the southwestern U.S., La Niña makes a bad situation even worse. The temperature and precipitation trends in this La Niña year suggest that the western U.S. “megadrought” is likely to remain with us through 2022
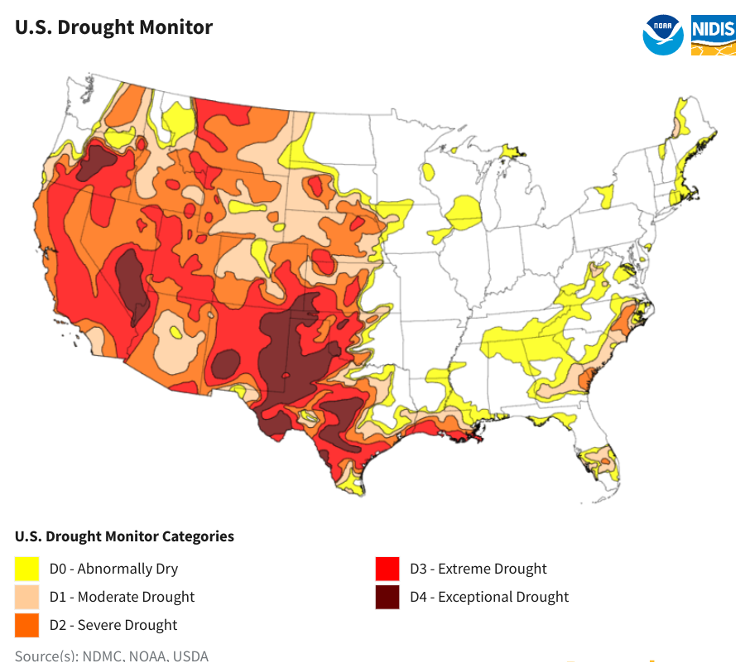
The National Integrated Drought Information System (NIDIS) reports that as of May 17, 2022, 52.54% of the continental U.S. was in drought, as shown in the map below. The Southwest and the western parts of the Central and Southern Plains have been dry and windy, coupled with extreme heat in Texas. The result is a major expansion of Extreme and Exceptional Drought in these regions.
Due to a combination of climate warming and La Niña, the western U.S. experienced a very dry winter — setting the stage for a fire-prone summer. Below-average winter and spring precipitation in the western U.S. did nothing to alleviate the increasing fire risk. Any late season rain or snow may have actually increased the fire risk by stimulating the growth of grasses and shrubs that become fire fuel when they succumb to the drought. The June through August temperature and precipitation forecasts, on top of a landscape already dessicated by long-term severe and extreme drought, suggest that the 2022 fire season will be severe.
The map below shows large wildfires active on May 22, 2022, alongside current drought conditions.
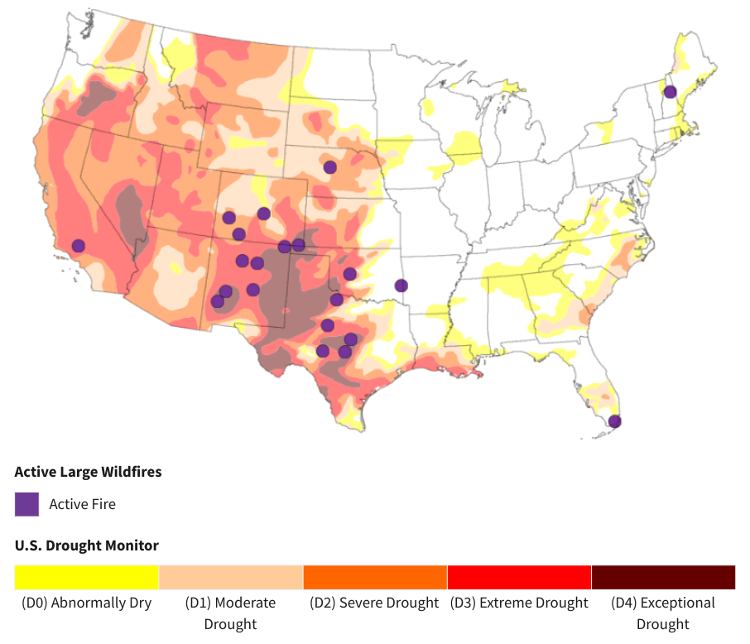
The number of wildfires and burned acreage in the U.S. is already well above normal ahead of the unofficial start of the fire season. The National Interagency Fire Center (NIFC) reports that the total acres burned up to the end of April was roughly 70% above the ten-year average. Add in the forecast heat and low precipitation, and we may be looking at another intense wildfire season.
On a more optimistic note, La Niña is expected to “boost” the North American Monsoon when (and if) it arrives in late summer, as it did in 2021. With above-average precipitation from the monsoon, the wildfire threat should begin to decrease. However, interactions between ENSO and the Monsoon phenomenon are not fully understood.
The NIFC predicts that this year’s Monsoon is likely to be a factor this summer, although potential early moisture surges during June could also result in periods of lightning-caused fire across the Southwest, Colorado, and the southern Great Basin.
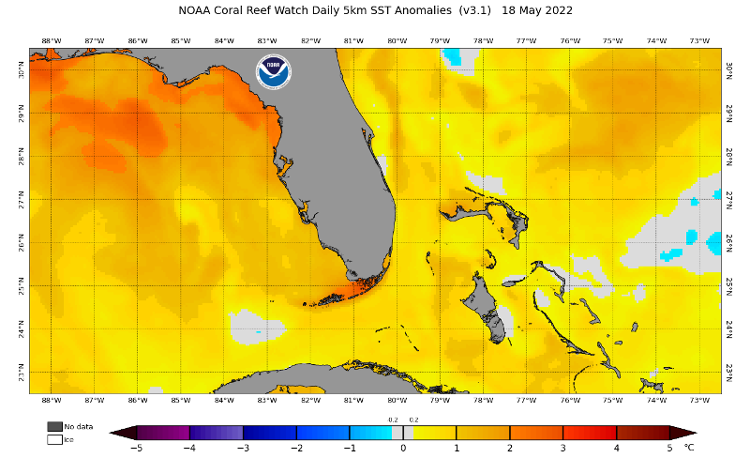
And Finally… Hurricanes!
The f0llowing image is an update to the similar sea surface temperature anomaly image Bob Bunting included in the CAC’s 2022 Hurricane Forecast. If you compare the April 6th image in the forecast post to the May 18th update, you can see that the sea surface temperatures are increasing as we expected heading into the 2022 hurricane season.