title image: BC Wildfire Service
The Heat Goes On…
Before we get into our discussion of a possible 2023 El Niño, rapidly changing conditions warrant a quick weather update.
In Part 1 of this post we suggested that 2023 was off to a hot start. Well, that’s turned into something of an understatement. As shown in the chart below, the global temperatures in the latter half of May remained well above 2022 levels and then soared to record levels in early June.
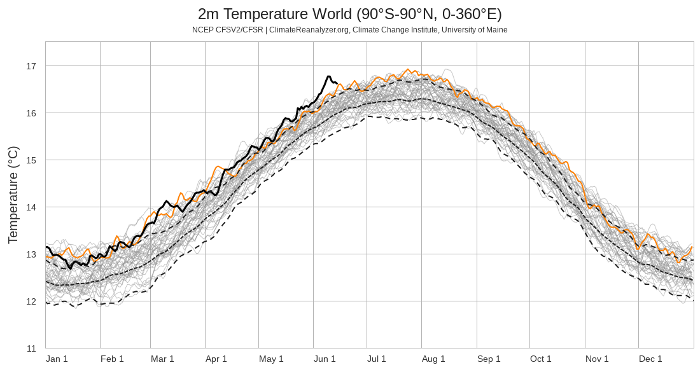
Average daily surface air temperatures for the planet, since 1979. Each line represents a single year. 2022 temperatures are shown in orange. The heavy black line shows 2023 temperatures to date Data from the National Centers for Environmental Prediction (NCEP), Chart by Climate Change Institute, University of Maine
Even as we prepare this post, the National Weather Service is reporting more than 30 million people in Texas. Louisiana and Florida are under Heat Advisories. Over 3 million in south Texas are under Excessive Heat Warnings. The Heat Index in south Texas could reach 120 degrees, while south Florida is expected to see heat indices as high as 110 degrees.
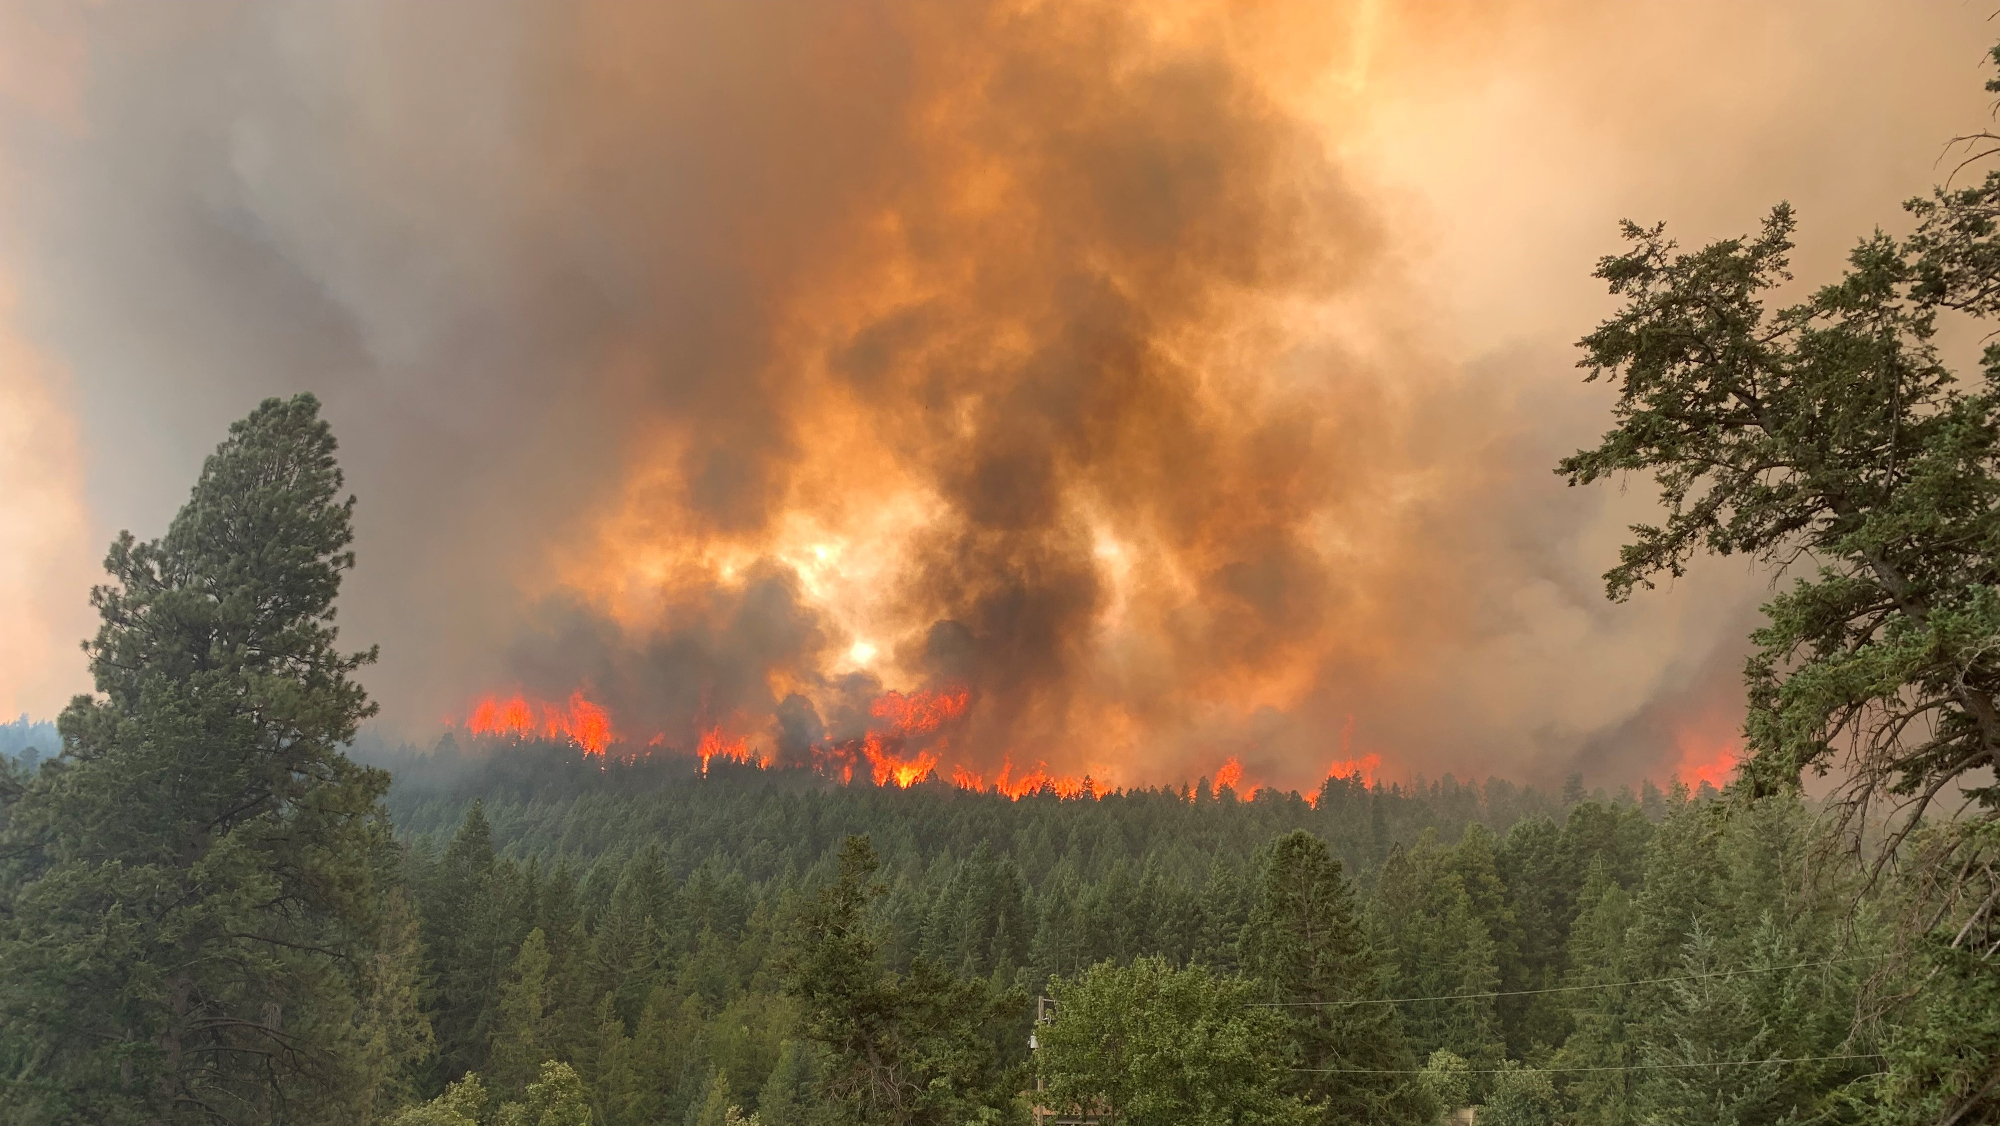
Meanwhile, the Pacific Northwest/Canada heatwave we discussed in Part 1 has continued to ravage the forests of Northern Canada. Unusually hot, dry weather this spring rendered hundreds of square miles ready to burn, and lightning strikes provided the ignition. So far, over 13 million acres have burned, spreading toxic smoke over much of the US and Canada.
But that’s not all… Tornadoes and severe thunderstorms are expected across the south-eastern US in the coming days, while the northern plains states will experience continued air quality issues from ongoing forest fires in Canada.
We are definitely off to a tumultuous start to the summer of 2023! Even so, a potential El Niño could take global weather to another level.
El Niño
El Niño and La Niña are opposite extremes of a naturally occurring cycle in atmosphere over the Pacific Ocean—the El Niño Southern Oscillation or ENSO. NOAA has an excellent ENSO explainer, if you would like to explore the phenomenon in depth.
Briefly, the indicator of an El Niño phase is above average ocean temperatures in the Equatorial Pacific, while La Niña is characterized by unusually cold sea surface temperatures in Equatorial Pacific.
The figure below shows the sea surface temperatures during a strong La Niña in 1998. The Eastern Pacific is colder than normal and cold water extends from the northwest coast of South America, westward along the equator. Strong Easterly trade winds are pushing warm surface water westward toward Indonesia, triggering an upwelling of colder deep ocean water in the Eastern Pacific.
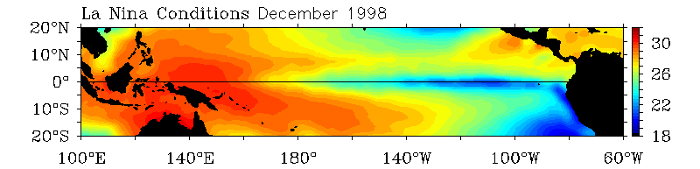
Image: NOAA
Contrast the La Niña conditions shown above with the figure below, showing the tropical Pacific sea surface temperatures during a strong El Niño. In this instance, weaker trade winds allow warmer than average surface water to develop eastward along the equator, and the hottest temperatures are now in the central Equatorial Pacific. Note that both figures are fairly extreme examples. There exists a full range of weaker La Niña and El Niño scenarios, centered on a “neutral”transitional phase.
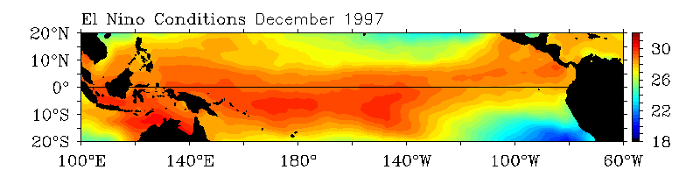
Image: NOAA
So, now that our “triple dip” (three years running!) La Niña has ended, will it be followed by an El Niño event? If so, how strong will it be, and why do we care?
El Niño is on the way
In May, El Niño was a possibility. It became a virtual certainty by mid-June. Sea surface temperatures in the Pacific are rapidly trending towards an El Niño scenario, with the current SST data showing warm temperatures across the Equatorial Pacific.
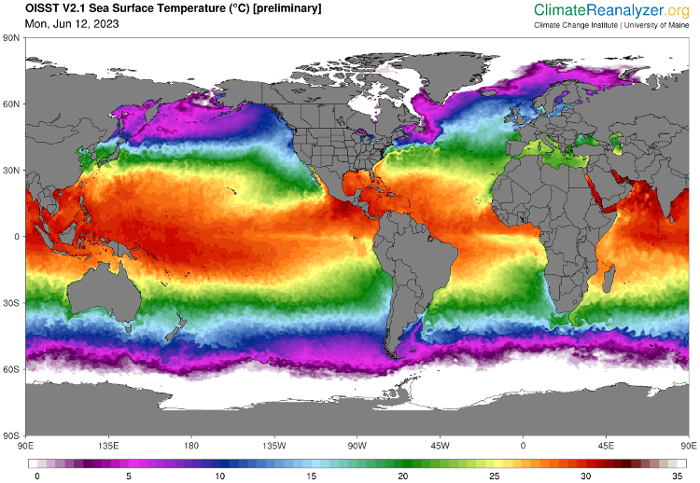
In fact, sea surface temperatures are on the rise around the world. The chart below shows that 2023 has continued to set daily SST records since Part 1 of this post in May. Warmer oceans transfer more heat and water vapor to the atmosphere, disrupting “normal” weather around the world.
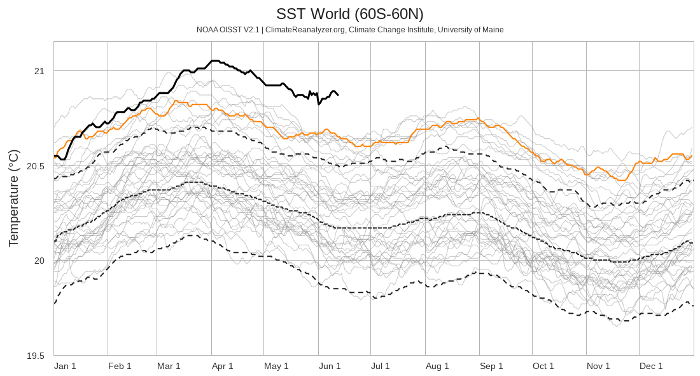
Global daily average Sea Surface Temperature. The solid black line represents 2023 SST through June 12, while the orange line shows the data for 2022. The grey lines show daily SST data going back to 1981, with the central dashed line showing the 1982-2011 average. Graphic courtesy of the Climate Change Institute, University of Maine
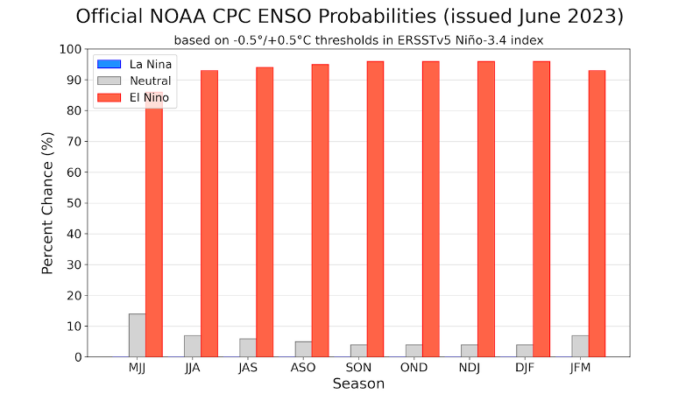
Returning to the Pacific Ocean, this warming trend is leading to a very rapid transition from last year’s La Niña to a 2023 El Niño. The chart below shows that there is now a better than 90% chance that a new El Niño will develop by winter, with a less than 10% chance of neutral conditions.
Why is ENSO so important?
What appear to be innocuous changes in the central Pacific Ocean actually affect weather around the world. An El Niño increases the average global temperature by about 0.2C over and above anthropogenic climate warming. Warmer waters in the Pacific transfer heat and moisture to the air above. The warm moist air rises into the atmosphere, changing normal rainfall patterns and heat transfer. El Niño also ramps up extreme weather, including heat waves, droughts and heavy rainfall events.
El Niño 2023
There is a lag between development of an El Niño and its impact on global temperature. Closely following the 2022 La Niña, the developing 2023 El Niño will probably have its greatest impact on 2024 global temperatures. Its impact on weather patterns will likely be felt sooner.
During El Niño, warming waters in the eastern Pacific Ocean transfer heat and moisture to the air above. The warm, moist air rises and changes normal rainfall patterns and the associated release of heat into the atmosphere. In turn, this sets up waves in the atmosphere that change the jet stream and storm tracks. The sea surface temperature anomalies associated with El Niño tend to peak during the Northern Hemisphere winter, so that’s when we expect its greatest impacts on weather.
The following figure illustrates the North American winter weather patterns typical of El Niño and La Niña.
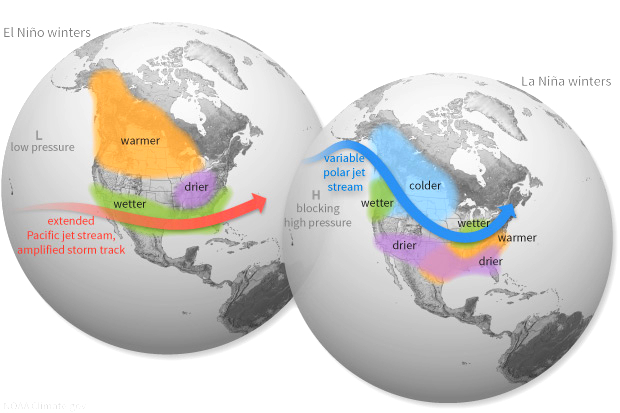
Maps courtesy NOAA/Climate.gov
The La Niña map is certainly in line with the last few winters, which featured frequent southerly intrusions of cold Arctic air and persistent dry conditions in the southwestern US.
With the developing El Niño, we can expect a drier, warmer winter in the Northern US and much of Canada, while the Southeastern US and the Gulf Coast experience a wetter-than-average winter. Future weather is much harder to predict than climate, so we will have to wait and see how the winter of 2023 develops. Nonetheless, data from previous El Niño events suggests what we might expect this winter.
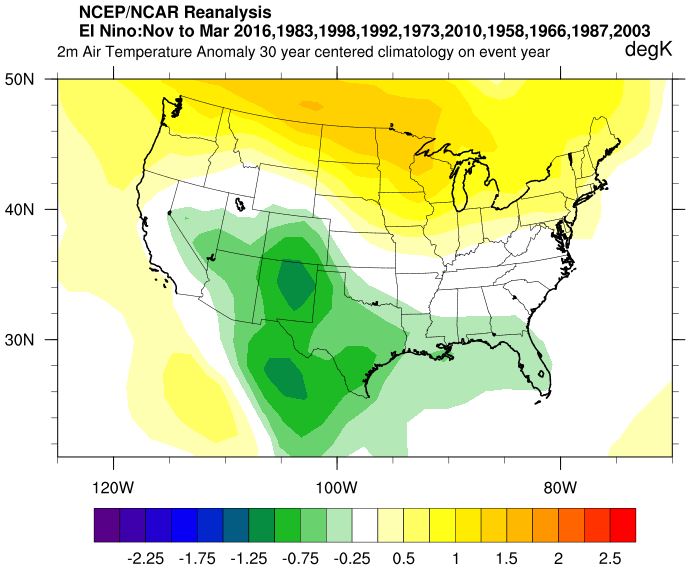
The National Center for Environmental Prediction (NCEP) has analyzed winter temperature anomalies for past El Niño events, and the results suggest below average temperatures in the South-central US, and a warmer winter in Canada and the northern Mid-West.
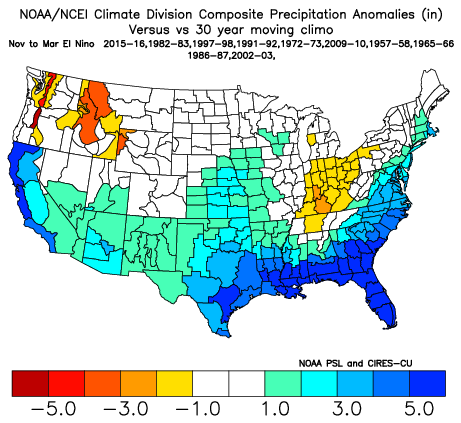
Similarly, NOAA’s National Centers for Environmental Information has crunched the numbers for precipitation anomalies for past El Niño events. These are exactly what we would expect.
El Niño and extreme weather
With the 2023 Atlantic hurricane season officially underway, those of us in Florida are particularly interested in the potential impact of the developing El Niño. The relative impacts of an established El Niño event on Atlantic and Eastern Pacific hurricanes is shown in the figure below.
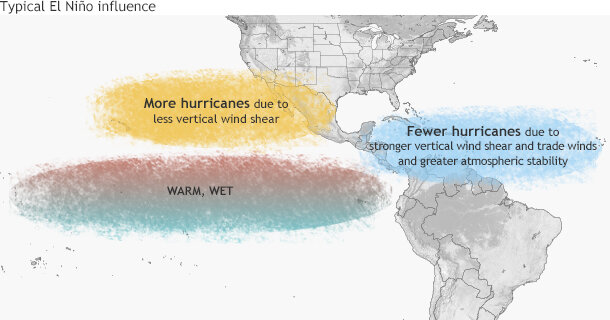
Image credit: NOAA/Climate.gov
The CAC’s 2023 Hurricane Forecast explains the interaction between El Niño and hurricane development in detail. In brief, an El Niño tends to inhibit hurricane creation in the Atlantic. On the ot.her hand, the unusually high ocean temperatures discussed earlier in this post normally favor the formation of more and stronger hurricanes. As a result, the strength of this year’s hurricane season is likely to hinge on the speed with which this year’s El Niño develops.
The apparent rapid development of this El Niño suggests that it may have a greater than expected damping effect on hurricane formation later in the 2023 hurricane season.
Regardless of the strength of this El Niño event, there still will be hurricanes that make landfall in the US. Hurricane Michael made landfall as a Category 5 during the 2018 El Niño, devastating the Florida panhandle. Be prepared!