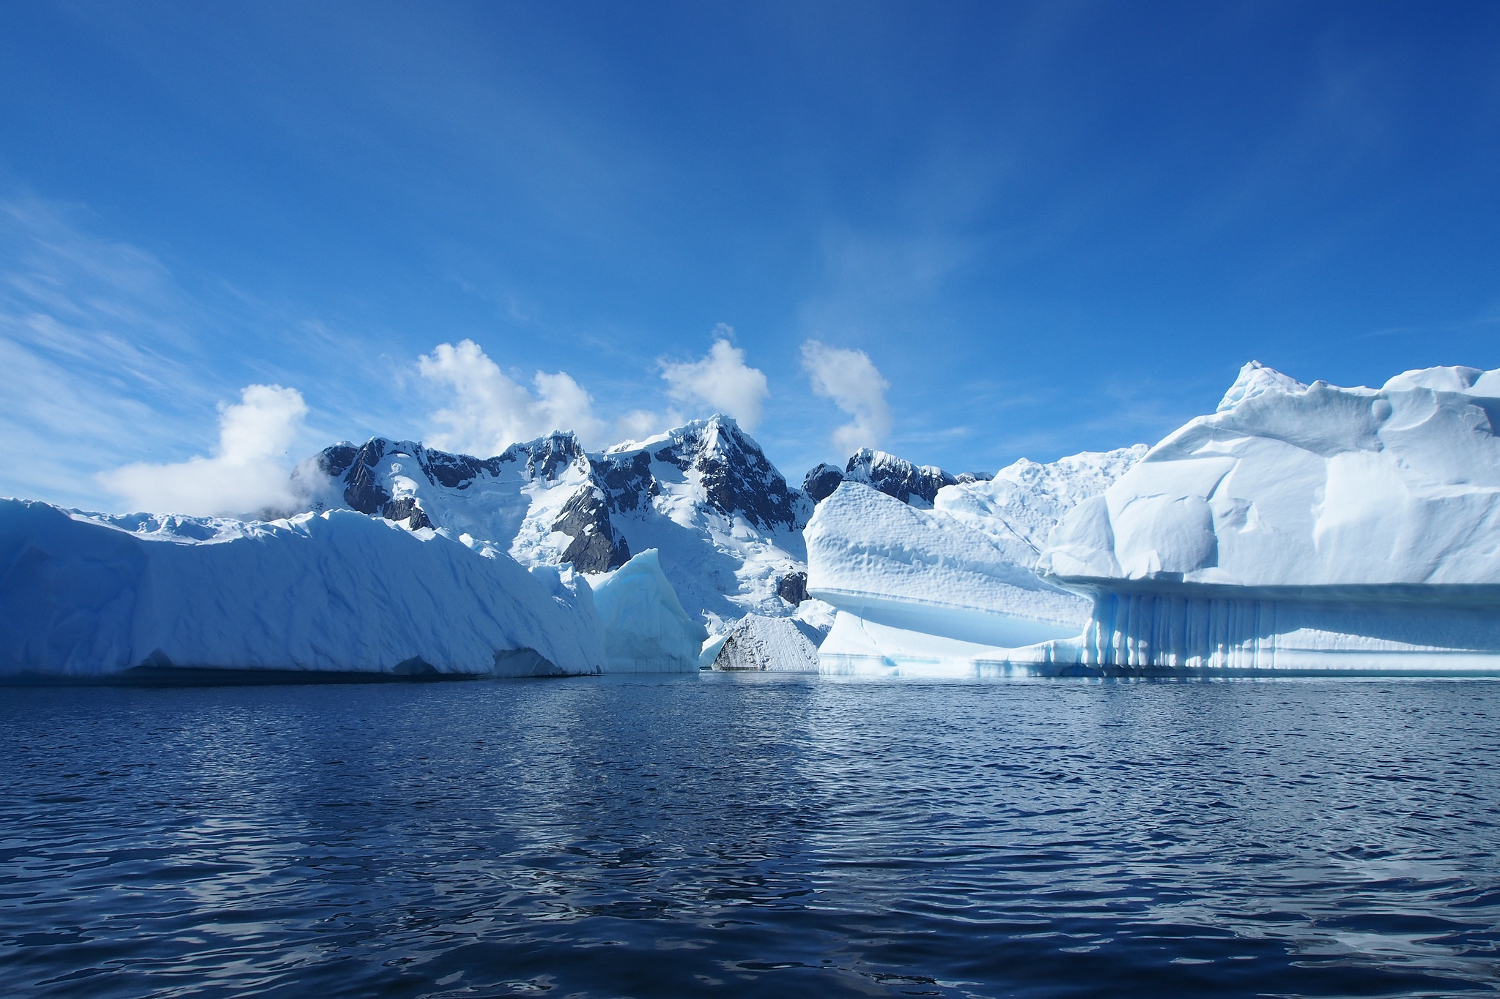
Title image: Andreas/Flickr CC BY 2.0
The Sleeping Giant Awakens

Flashback: January, 2022
Long-time readers may recall a previous post in 2022 in which we discussed the impacts of climate change on the Antarctic. (If you have a few minutes to spare, it would be a great way to start this article.)
So, why do we need another article just two years later? Well, 2022 and 2023 were tumultuous years for Antarctica and the planet and much has changed.
What’s New?
In 2022, just two months after we posted our previous Antarctica article, a research station on the East Antarctic plateau logged the largest temperature jump ever recorded anywhere —39C° (70F°) above the seasonal average. This was not an isolated event—it was part of an unprecedented “polar heatwave” over much of East Antarctica.
On a planetary scale, 2023 turned out to be the hottest year in the modern temperature record going back to 1850. The 10 warmest years in the 174-year record all occurred during the last decade (2014–2023).
Back in Antarctica, the summers of 2022 and 2023 saw an unprecedented loss of Antarctic sea ice, falling below 2 million square kilometers for the first time in the satellite record (1979 to the present). On February 21, 2023 sea ice reached a record-breaking minimum of 691,000 square miles (1.79 million square kilometers). In September the 2023 sea ice maximum extent also hit a new low, fully 1 million square kilometers (386,000 square miles) below the previous record. 2o23 marked the 8th year of a steep decline in Antarctic sea ice, in just a few years rivaling decades of decline in the Arctic.
During the two years after our last Antarctic article, a number of eye-opening studies illuminated not only the response of Antarctica to global climate change, but also the effect of Antarctic change on the rest of the world. We’ll look into that later in this post, but first, here’s a quick refresher on the current state of Antarctica, and its geological history.
The Evolution of Antarctica
Antarctica is the fifth-largest continent (after Asia, Africa, North America and South America), comprising 20% of the Southern Hemisphere. And it’s big:
- total area of 5.5 million square miles (the continental US covers 3.1 million square miles)
- the highest point on the continent is 13,451 ft above sea level. The average elevation of the Antarctic surface is 8,200 ft (2,500 m), making it the highest continent
- 98% of the continent is covered by the Antarctic Ice Sheet
- average thickness of the ice sheet is about 7,200 ft (2,200 m), with a maximum thickness of 16,000 ft (4,900 m)
- the ice sheet contains approximately 7 million cubic miles (29 million cubic kilometers) of ice, which amounts to 90% of the world’s ice and 70% of the world’s fresh water
- floating ice shelves are anchored to 75% of the coastline
The continent of Antarctica is part of the Antarctic Plate, one of the seven tectonic plates formed by the breakup of the Pangea supercontinent. The plates gradually drifted apart between 195 million and 170 million years ago. Roughly 100 million years ago, atmospheric concentrations of CO2 and other greenhouse gases (GHGs) were higher than today and Antarctica was warm and ice-free. GHGs fluctuated over time but steadily decreased, eventually reaching “pre-industrial” levels, and by 55 million years ago, Antarctica was experiencing long-term cooling.
Around that time, Antarctica completed its separation from the other continents, finally severing its remaining connection to the southernmost tip of South America around 30 million years ago, opening up the Drake Passage. This marked the complete isolation of the continent and enabled the formation of today’s Antarctic Circumpolar Current (ACC), which encircles Antarctica, driven by subpolar westerly winds. Antarctica’s polar location and its separation from warmer oceans by the ACC, coupled with continued global decline in GHG levels, enabled the rapid accumulation of ice across the continent.
The East Antarctic Ice Sheet reached its current size roughly 13.8 million years ago, while the West Antarctic Ice Sheet (WAIS) was completed about 6 million years ago.
The map below shows Antarctica as we find it today. The Transantarctic Mountains divide the continent into East Antarctica and West Antarctica, each with its own ice sheet. The dark grey areas along the coast are ice shelves – the floating extensions of ice sheet glaciers flowing toward the coast.
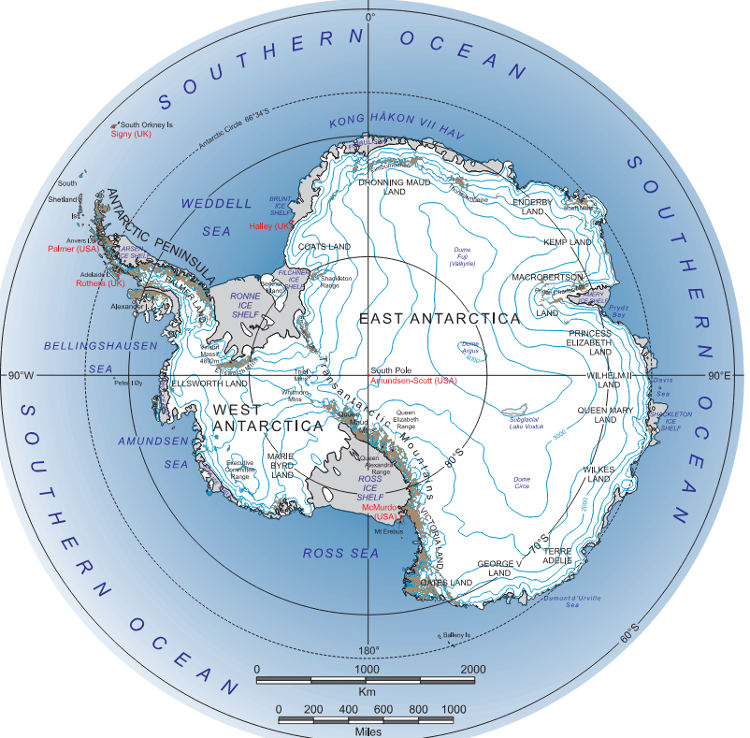
Figure 1: Map courtesy of the U.S. Geological Survey and the International Landsat Image Mosaic of Antarctica (LIMA) project
Antarctic Climate Change
While the effect of global climate change on the Arctic and Greenland has been the focus of extensive research, Antarctica has been out of sight, out of mind for too long. Only recently have research results from field work, satellite data and climate/ocean models come together to evaluate the effects of climate warming on Antarctica and their global impact.
The Arctic has responded quickly to climate change, warming 4 times faster than the global average via “Polar Amplification”. This results from relatively rapid melting and breakup of sea ice under higher temperatures, amplified by positive feedback from newly open water warming rapidly through exposure to the sun. On the other hand, the Antarctic’s massive ice sheet creates a tremendous amount of inertia in the continent’s response to external warming. Compared to the Arctic, the Antarctic is warming “only” twice as fast as the global average—around 20-50% more warming than climate models predicted just two years ago.
Since 1950, 90% of anthropogenic climate warming has been absorbed by the global oceans. From 2005 to 2014, the Southern Ocean (south of 60° S latitude) surrounding Antarctica accounted for more than 60% of the increase in global ocean heat content. This isn’t reflected in sea surface temperature but deeper in the mid-depths of the Southern Ocean, which are warming twice as fast as the upper levels of the global ocean as a whole.
Recent Antarctic research puts the spotlight on two key areas of global concern: sea level rise and the ocean’s ThermoHaline Circulation, or THC.
Ice Sheets and Sea Level Rise
Within the closed loop of the global water cycle, two dominant processes drive global sea level rise—thermal expansion of the oceans and melting land ice (glaciers and ice sheets). The physics of ocean thermal expansion is complex but well understood. However, our ability to project the response of ice sheets to climate change, and thus future sea level, is hampered by a scarcity of observations spanning the full range of ice sheet behaviors and processes, and our limited understanding of how those processes interact.
Note that global sea level is not the same as local sea level. At many US locations along the Gulf coast and the eastern seaboard the rate of local sea level rise is greater than the global average, largely due to land processes like erosion, oil and groundwater extraction, and subsidence.
As the graph below illustrates, over the last 30 years the global average sea level has steadily increased. Perhaps more important, the upward curve shows that the rate of sea level rise is increasing.
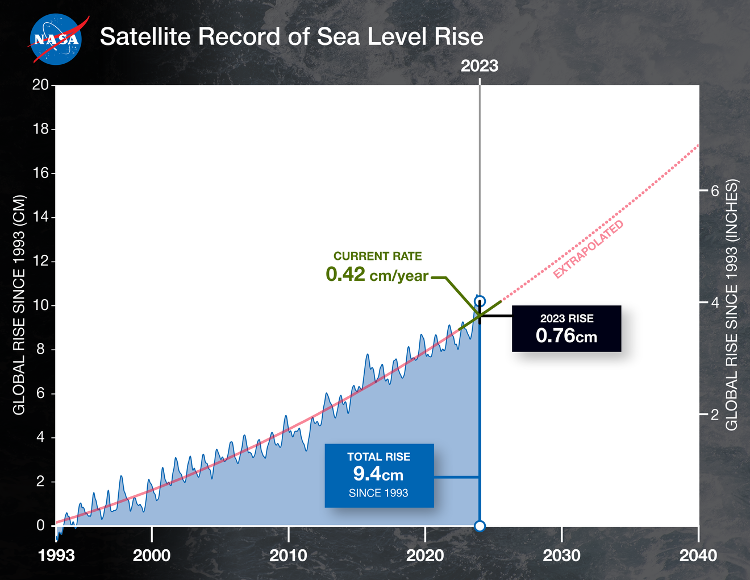
Figure 2: SLR satellite record
According to NASA, data shows that global average sea level has risen a total of about 4 in (94 mm) since 1993. The rate of sea level rise has also accelerated, nearly tripling from 0.06 in (1.4 mm) per year through most of the 20th century to the current rate of 0.17 in (4.3 mm) per year.
The Antarctic and Greenland are far and away the greatest potential contributors to future global sea level rise, and the least understood. If both ice sheets melted, the Antarctic Ice Sheet would raise global sea level 57.9 m (about 190 ft), while the Greenland Ice Sheet would add another 7.4 m (about 24 ft). The potential sea level rise from the Antarctic Ice Sheet has three components: the West Antarctic Ice Sheet (WAIS) – 4.3 m, the East Antarctic Ice Sheet – 53.3 m, and the Antarctic Peninsula – 0.2 m.
Since 2002, the satellites of NASA’s Gravity Recovery and Climate Experiment (GRACE) have been able to monitor the change in mass of the Greenland and Antarctic ice sheets. The 2024 image below shows the changes in ice sheet mass between 2002 and 2023. Orange and red indicates a loss of ice mass, light blue indicates increased ice mass, and white indicates little or no change in mass.
The Greenland average mass loss of 269 Gigatons/year is causing global sea level to rise by 0.8 mm/year, while Antarctic mass loss is contributing a further 0.3 mm/year. (one Gigaton is one billion metric tons.)
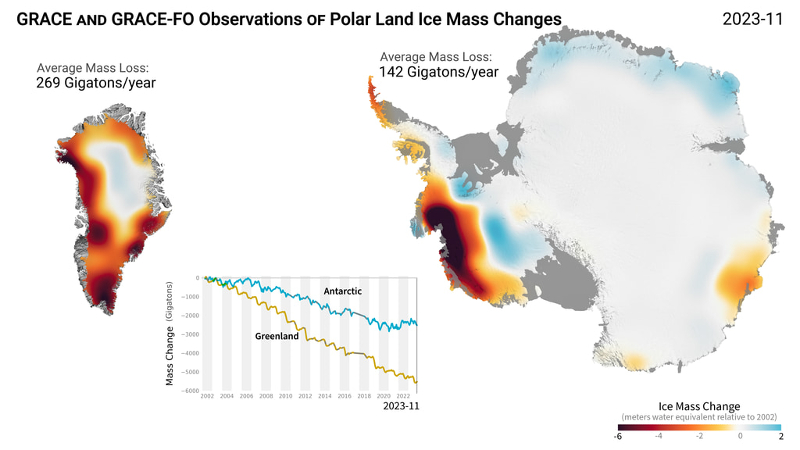
Figure 3: Ice Mass Loss in Antarctica and Greenland Credit: NASA
A recent report from the International Cryosphere Climate Initiative (ICCI) asserts that Greenland is losing ice at a rate “three times what it was 20 years ago,” while Antarctica’s ice loss is “six times greater than it was 30 years ago.” Smaller alpine glaciers in the rest of the world are also melting, but their total contribution to sea level rise is relatively small.
Predicting Future Sea Level Rise
While today’s CO2-driven climate change scenario is unprecedented in human history, similar circumstances existed in the geological record that give us an idea of what to expect in the way of global sea level rise, and the process that will get us there. About 3.2 million years ago, during the Pliocene epoch, CO2 levels were about 400 ppm, and temperatures were 2-3°C above the “pre-industrial” temperatures of 1850-1880. At the same time, proxy data indicate global sea level was about 16 m (within a 12-20 m range) higher than today.
The polar mass loss provides clues to the likely contributors to the 16 m difference in sea level. The Greenland ice sheet is the weakest link and likely collapsed. Today’s Antarctic mass loss suggests that the next biggest source was the West Antarctic Ice Sheet (WAIS). An additional, smaller contribution comes from Wilkes Land in the East Antarctic Ice Sheet.
Bear in mind that climate changes in the past were characterized by gradual increases in GHGs and small changes in temperature, within a framework of gradual changes in earth’s orbit and the tilt of its axis. Over the last 800,000 years, CO2 never exceeded 300 ppm. Today’s climate change scenario—increasing atmospheric CO2 by more than 50% in a little over 100 years—is simply off the charts.
Consider that we are already nearing the Paris Agreement target of 1.5°C, with CO2 and temperatures still rising. If we meet current commitments to reduce greenhouse gases (spoiler alert – we aren’t), global average temperature will reach 2.7°C above the pre-industrial average by the end of the century. The ICCI meta-report “State of the Cryosphere 2023” doesn’t beat around the bush:
“A compelling number of new studies, taking into account ice dynamics, paleo-climate records from Earth’s past, and recent observations of ice sheets behavior, all point to a threshold for both Greenland and parts of Antarctica well below 2°C, committing the planet to between 12-20 meters of sea-level rise if 2°C becomes the new constant Earth temperature.”
Research supports the conclusion that by 2°C, virtually all of Greenland, most of West Antarctica and part of East Antarctica (areas highlighted in the earlier mass loss figure) will be locked into long-term, irrevocable sea level rise, even if we succeed in drawing down temperatures at a later date. This is primarily because the warmer ocean will hold heat much longer than the atmosphere, and because of a number of self-reinforcing feedback mechanisms. As a result, it takes ice sheets much longer to grow back (tens of thousands of years) than to lose their ice.
Greenland offers a straightforward example of one such a feedback process. The Greenland Ice Sheet compensates for mass loss at lower, warmer elevations by accumulating snowfall on the high, cold central area of the ice sheet. Ice loss currently exceeds snowfall replenishment so the ice sheet is shrinking. As it shrinks, the central area becomes lower and warmer, exposing more of the ice sheet to melting. Eventually, precipitation shifts towards rainfall instead of snowfall, and what snow does reach the ice surface rapidly melts. Rainfall on the Greenland Ice Sheet has already increased more than 30% since 1991, and the frequency of extreme rainfall events is increasing.
So, we will be committed to 12-20 m of sea level rise at 2°C, but on what timescale? It is difficult to predict the near future (just ask a meteorologist) but we do know that if temperatures pass 3°C, ice loss from Greenland and Antarctica may become extremely rapid, potentially reaching 5 cm (2 in) per year by 2150. Three meters might be passed early in the 2100s, with five meters reached by 2200. So the worst impacts may seem to be comfortably in the future, but remember that sea level rise will be unstoppable.
Here’s what 3.5 m of sea level rise will look like in South Florida and the Bahamas (the red areas are below the typical high tide level):
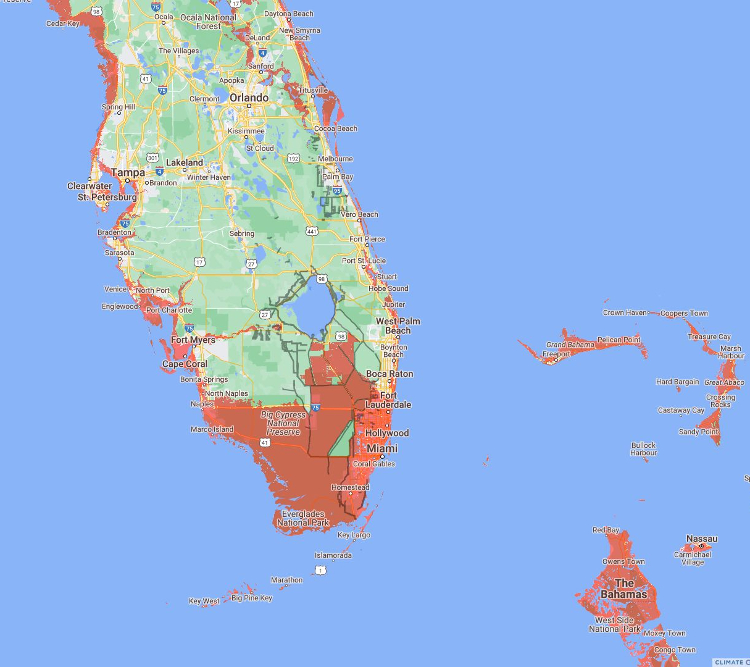
Figure 4: Predicted high tide inundation at 3.5 m SLR Credit: Climate Central
Oceans Control the Stability of the Antarctic Ice Sheet
Ironically, changes in ocean circulation are driving the Antarctic ice mass loss in Antarctica that in turn drives sea level rise.
Circulation in the Southern Ocean is dominated by the Antarctic Circumpolar Current (ACC), arguably the most important current on Earth. Propelled by never-ending westerly winds and unobstructed by land, the ACC circles Antarctica on a clockwise path, as shown in the map below. It is Earth’s most powerful current, carrying 165 million to 182 million cubic meters of water every second, moving 100 times as much water as all the world’s rivers combined. The current reaches widths of up to 2,000 kilometers (about 1,243 miles) and depths of up to 4,000 meters (about 13,123 feet).
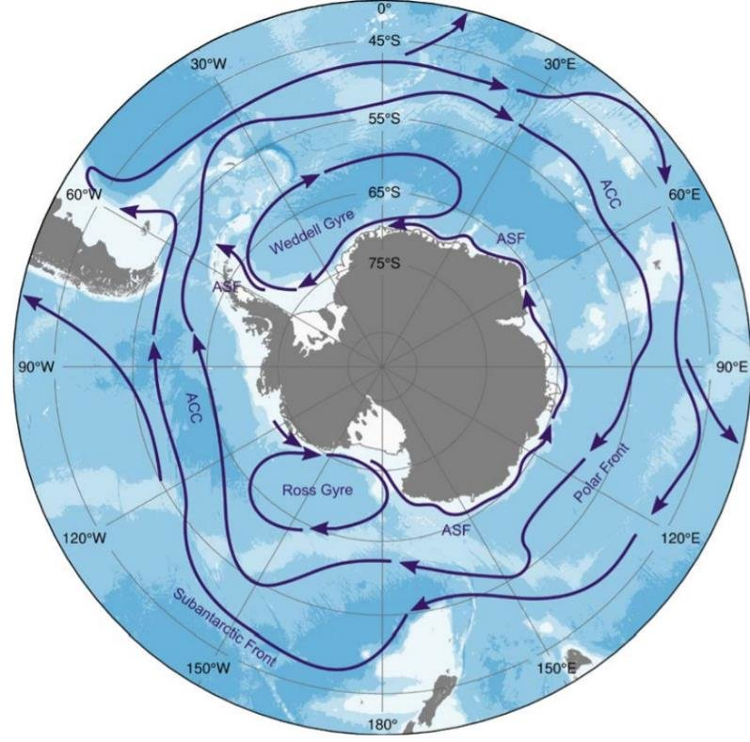
Figure 5: Major Southern Ocean circulation features (adapted from Rintoul et al. 2001) Credit: C. Moreau, 2019
The ACC plays a key role in the global ThermoHaline Circulation (THC), connecting the Atlantic, Pacific and Indian oceans, controlling the exchange of water masses between the world’s oceans in the process. In fact, the existence of the ACC and its inter-basin connection is what allows the global overturning circulation to exist.
The Atlantic overturning component of the THC brings deep waters formed in the North Atlantic southward into the Southern Ocean. (For more information on the THC, see CAC articles here and here.) Once there it is entrained by the ACC and becomes Circumpolar Deep Water (CDW). CDW is relatively warm (by polar standards),very salty and dense. Within the ACC it sinks beneath the colder, less dense water near the surface. circling Antarctica at a depth of about 1,600 ft (about 490 m).
A clear path for the ACC opened up about 34 million years ago, after Antarctica separated from the other continents to the north and the ice sheets began building up. The current started flowing as it does today 12 million to 14 million years ago.
In a new study, researchers analyzing ocean sediment cores were able to determine the ACC’s relationship to climate over the last 5.3 million years. It turns out that the ACC changed in tandem with temperature, slowing in cold climates and accelerating in warm climates—faster flowing periods linked to significant losses of Antarctic ice. In brief, they found:
- ACC strengthening corresponds to West Antarctic Ice Sheet (WAIS) retreat
- ACC flow was stronger than today during warmer-than-present intervals of the Plio-Pleistocene. This means future climate warming is likely to increase ACC flow.
- Reconstructions of strong ACC flow during warmer-then-present intervals indicate that WAIS retreat or collapse may be directly linked to enhanced ACC flow
The study suggests that today’s ACC speedup will continue as anthropogenic climate warming proceeds. That is likely to hasten Antarctic ice melt, increase sea levels, and possibly affect the ocean’s ability to absorb carbon from the atmosphere.
Scientists have observed that winds over the Southern Ocean have increased in strength about 40% in past 40 years. While the speed of the ACC seems more directly dependent on temperature, the winds energize large-scale eddies within it that move CDW toward the coast of Antarctica and its huge floating ice shelves, which are holding back the interior glaciers. Shifts in regional winds and associated changes in ocean currents are pushing relatively warm CDW toward Antarctica’s ice shelves. The warm water melts the ice shelf from below, weakening the shelf and loosening it from rocky seafloor “pinning” points that are bracing the shelf against the glacier behind it. As the ice melts away from the pinning points, it can float to sea and disintegrate faster, allowing the glacier behind it to accelerate toward the ocean.
In parts of Antarctica, especially in the west, these warm waters are melting the undersides of the ice shelves and penetrating to the base of outlet glaciers for WAIS and some areas of East Antarctica. In the last 30 years, the amount of ice flowing out to sea from the Thwaites and Pine Island glaciers in West Antarctica, and their associated floating ice shelves has doubled. The flow of CDW poleward from the ACC toward the Antarctic coast, not warming air temperatures, is melting ice shelves and glaciers, raising sea levels.
Why Some Antarctic Glaciers Are Particularly Vulnerable
The future of many Antarctic glaciers is tied to the ocean. A marine glacier is a glacier the comes into contact with the ocean at a grounded terminus, a floating terminus, or ice shelf. Greenland outlet glaciers are “marine glaciers.” They flow down to the sea and, in many cases, into the sea.
Glaciers like Thwaites (the “Doomsday Glacier”) and the neighboring Pine Island glacier are “marine glaciers” too, but like many Antarctic glaciers, they are highly vulnerable to Marine Ice Sheet Instability, or MISI. The marine glacier in Fig. 6 is grounded on a “retrograde” slope – the glacier is grounded below sea level and the bedrock surface beneath it slopes away from the sea, so when the grounding line retreats, the thickness of the glacier at the ice front increases. Thicker ice flows faster and the glacier thins. Once it starts, the process is self-sustaining.
The behavior of the water flowing into the cavity beneath the ice shelf contributes to the instability. In an Antarctica scenario, the ocean water flowing toward the cavity is CDW, both warm and dense. It is more dense than the water in front of the ice shelf that is mixed with less dense fresh water, so it slides beneath until it reaches the cavity where it comes in contact with the ice at the grounding line and the bottom of the ice. As that ice melts on contact with the CDW, the lighter combination of CDW and meltwater rises along the base of the ice.
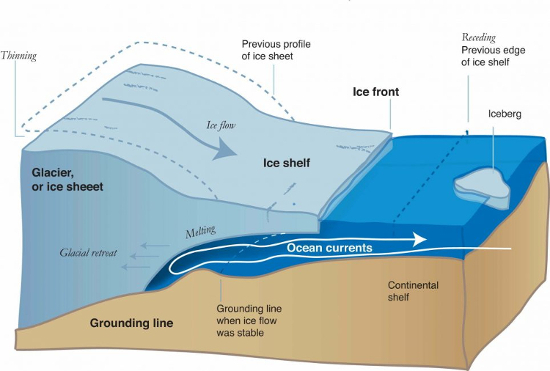
Figure 6: An example of an unstable marine glacier.
Another positive feedback occurs as the grounding line moves down the slope and becomes deeper. The seawater freezing temperature decreases by about 0.75°C for every 1,000 m of depth. As a result, the highest melt rates at the base of the glacier occur near deep grounding lines. And this is a real problem in Antarctica, which boasts the deepest grounding lines in the world in East Antarctica, up to 2,100 m for the Totten Ice Shelf and 2,400 m for the Amery Ice Shelf.
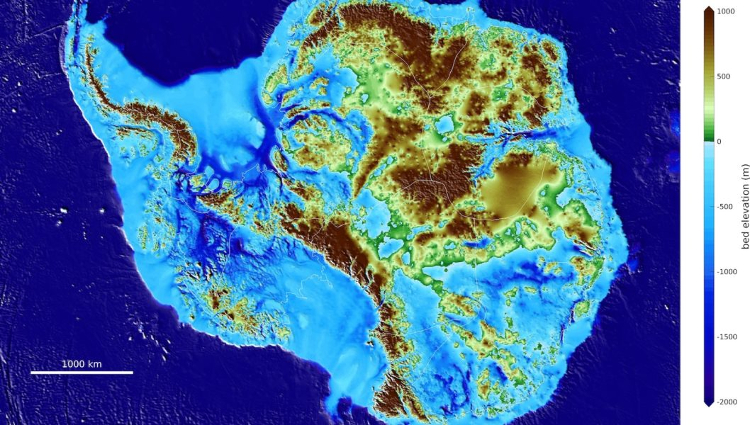
Figure 7: Credit: British Antarctic Survey, BedMachine 2019
Figure 5 shows the path of the ACC, and thus the CDW, around the continent. The greater the distance the CDW must travel to reach the grounding line, the more likely it will become diluted with colder, fresher local water, limiting ice melt. The poleward side of the current is located very close to the West Antarctica coast in the Amundsen and Bellingshausen Seas. The inflow of CDW from the ACC is easily able to reach the grounding line of the WAIS Pine Island Glacier with temperatures more than 3°C above the local freezing point.
East Antarctica is also close to the poleward boundary of the ACC, and measurements have shown that CDW is able to cross the shelf and drive glacier melting.
As we know from our previous article, the WAIS is actively retreating now. Although there has been comparatively little work done in East Antarctica, simulations suggest that outlet glaciers in the large marine-based regions of the East Antarctic Ice Sheet near the ACC are capable of significant contributions to sea level rise.
This Just In…
(Editor’s note: The following information arrived while this article was being completed. It was too good to pass up.)
Very little observational data is available for the active grounding zone of a glacier. Conventional models assume a fixed, abrupt transition from grounded ice to ice floating in the ocean with no ice melt at the transition boundary. This study used a novel approach using satellite-based Interferometric Synthetic Aperture Radar (InSAR) to measure subtle deformation of the surface of Thwaites Glacier (see Figure 9, below). Data acquired at high and low tides revealed that grounding happens in an active melt zone, not at a fixed grounding line.
In the case of Thwaites Glacier, seawater was flowing in and out of a tidally controlled daily grounding zone 2 to 6 km in length, with irregular additional seawater intrusions extending a further 6 km inland at spring tide. Instead of the fixed grounding line shown in Figure 6, reality is the grounding zone shown in the graphic below.
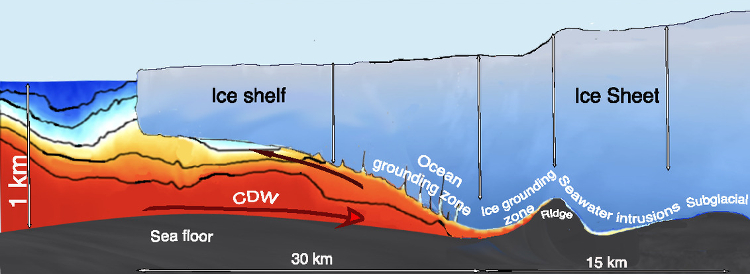
Figure 8: Thwaites Glacier cross section showing extensive warm water intrusion. Rignot et al, 2024
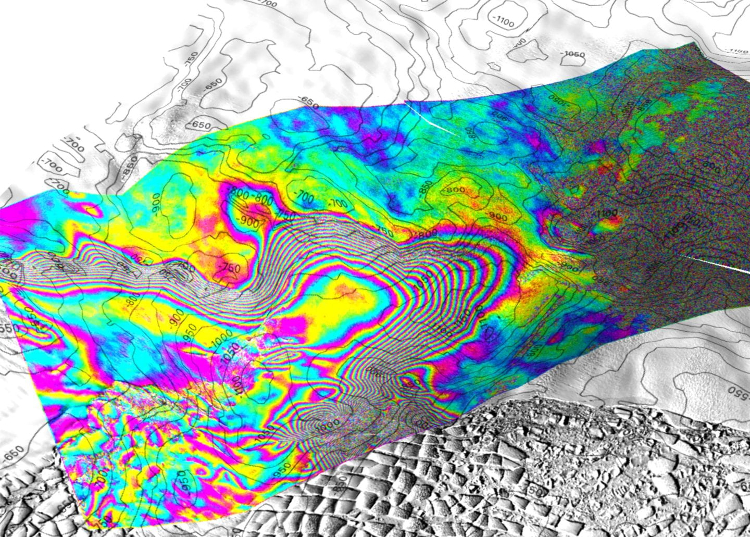 Figure 9: Interferometric radar image of lower Thwaites Glacier Credit: ICEYE/University of California Irvine
In the words of the authors, “Kilometer-wide, widespread seawater intrusion beneath grounded ice may be the missing link between the rapid, past, and present changes in ice sheet mass and the slower changes replicated by ice sheet models.
It appears that the future of Thwaites—and other Antarctic glaciers—will hinge on how fast warm waters erode grounding zones over large distances, much faster than anticipated by current models.
Consequences
The International Cryosphere Climate Initiative subtitled their 2023 State of the Cryosphere report “Two Degrees is Too High”—referring to the fact that a global average temperature 2°C above the pre-industrial would commit us to “extensive, potentially rapid, irreversible sea-level rise from Earth’s ice sheets; 3°C will further speed up this loss to within the next few centuries.”
Irreversible.
No silver bullet solution will get us out of that one. Sure, it will happen slowly. But it will happen. I wonder what our great-grandchildren will think.
“But it’s not just collapsing glaciers and absent ice that will be seen as Antarctica succumbs to climate change. The effects of the warming world on this continent won’t stay on this continent. Sea levels will rise around the world. Fisheries could collapse. Environments everywhere will change.” – Alok Jah, Science and Technology Editor, The Economist, May 15, 2024.
And the odds of us hitting 3°C are uncomfortably high. Time to get to work.