And It Hasn’t Peaked Yet
“El Niño is firmly established and strengthening rapidly. WMO forecasts indicate a near-100 per cent likelihood that it will persist through February 2027, potentially being one of the strongest since at least 1950.”
Those are the warning words of Celeste Saulo, Secretary-General of the World Meteorological Organization (WMO), introducing the WMO Global Seasonal Climate Update on October 8th.
A little more than four months ago, in our first article about the 2026 El Niño, it was a rapidly evolving climate event with the potential to become unusually strong. By mid-September, we speculated that it would be “Very Strong” (the highest official rating). Today, a month later, it has already earned the (unofficial) title of “Super” El Niño, surpassing the peak strength of every other El Niño in the post-1950 instrumental record. And it’s still developing.
On The Fast Track To A Record
The change has been remarkably rapid. The World Meteorological Organization says the average temperature anomaly (the deviation from the long-term average) in the central tropical Pacific’s key Niño 3.4 monitoring region climbed from 1.6°C above normal in June to 2.5°C in August. As shown in Figure 1, by mid-September the daily anomaly had reached 2.95°C.
By October 15 Niño 3.4 ocean temperatures reached a daily record of 3.35°C above the 30 year average for the date, marking three weeks with temperatures above the previous record of 3.08°C, set by the 2015-2016 “super” El Niño.
In more relatable terms, the actual ocean surface temperature in that part of the central Pacific in early October exceeded 30°C (86°F), for the first time in the observational record.
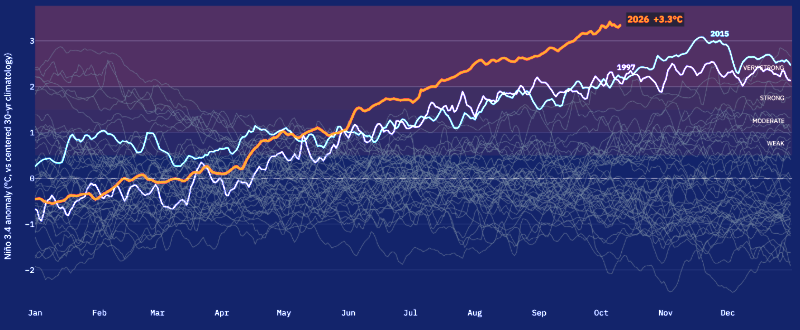
Figure 1: The Niño 3.4 temperature deviation from the long term average for 2026 (in orange), versus every other year since 1982. Also highlighted are the two recent “super” El Niño events of 1997-1998 and 2014-2016
The WMO 2026 October-November-December seasonal forecast estimates the seasonal average Niño 3.4 sea surface temperature anomaly to reach approximately +3.7°C, peaking around December. This will be the highest since observations began, and a huge jump from the previous record. The remarkable extent and intensity of the forecast Pacific ocean surface warming is highlighted in Figure 2.
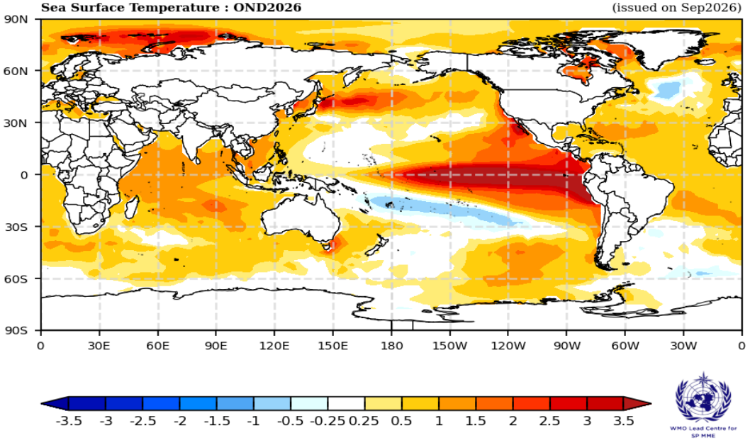
Figure 2: WMO forecast sea surface temperature anomaly (°C) for October – December 2026
A powerful Westerly Wind Burst (WWB), lasting 9 days in early October, has (temporarily) put the brakes on warming in the Niño 3.4 region. This doesn’t mean El Niño has peaked! These events can cause temporary localized ocean surface cooling through evaporation, but later lead to net warming as the winds further depress cold water upwelling and push warm surface waters eastward. As of October 16, warming in the Niño 3.4 region is holding at around +3.3°C, while the more eastern Niño 3 and Niño 1+2 monitoring regions continue to warm, currently at +4.2°C and +5.3°C respectively.
Predicting the El Niño Peak
Typically, El Niño events reach their maximum central Pacific temperatures in a brief two month window between mid-November and mid-January. There are three principal reasons for this narrow window in what is otherwise a long, drawn-out process.
1. The Ocean-Atmosphere Feedback Loop Breaks Down
As we explained in an earlier article, ENSO events are inherently coupled ocean-atmosphere events. In an El Niño event, warmer sea surface temperatures weaken both the Walker Circulation and the easterly trade winds, which in turn reduces cold water upwelling and allows sea surface temperatures to warm further, which further weakens the winds, and so on. This positive feedback loop (known as the Bjerknes feedback) is what steadily amplifies El Niño after it starts.
The atmospheric element of the feedback loop breaks down with the onset of the northern hemisphere autumn in October. Because the ocean responds relatively slowly, El Niño events lag behind atmosphere changes, peaking 2 to 3 months later—between November and January.
2. Seasonal Cycles of the Trade Winds
In late autumn and early winter, the easterly trade winds weaken as part of the normal seasonal cycle. By the northern hemisphere spring (April) the trade winds become stronger and more stable, pushing warm equatorial Pacific water to the west and inhibiting El Niño development. But by late autumn, the weakening trade winds allow a developing El Niño to reach its maximum.
3. Seasonal Migration of the ITCZ
The Inter-Tropical Convergence Zone (ITCZ)—the belt of heavy rainfall near the equator—follows the sun, shifting north and south with the seasons. By late autumn in the northern hemisphere, its location maximizes the efficiency of the ocean-atmosphere feedback loop, further reinforcing the winter El Niño peak.
What Can We Expect From This El Niño?
The latest WMO outlook now gives El Niño a near-100% probability of persisting through February 2027. It projects an October-through-December Niño 3.4 seasonal anomaly near 3.7°C, peaking around December.
A more recent update from the Climate Dashboard puts the Niño 3.4 peak anomaly in the range of 3.7°C to 4.3°C, with a central estimate of 4.0°C. This year’s El Niño has been setting ocean temperature anomaly records since September 20, and it’s not close to peaking yet. We are expecting dramatic impacts if it continues along this path.
The graph below shows just how exceptional the 2026 El Niño is likely to become. A “super” El Niño, indeed!
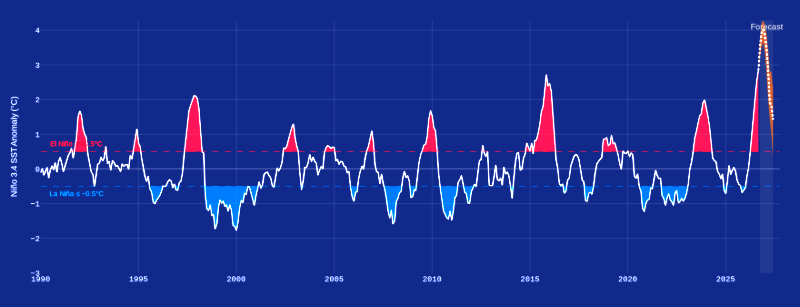
Figure 3: Every El Niño (red) and La Niña (blue) since 1990. Note that an event is only classed as a potential El Niño or La Niña when it generates a Niño 3.4 SST anomaly greater than +/- 0.5°C. The 2026 El Niño is in totally uncharted territory. Credit: Climate Brink
Location, Location, Location
This El Niño has already set another, perhaps equally important, record—it is the “easternmost” El Niño on record by a wide margin. This is tracked by the ENSO Longitude Index (ELI), a climate indicator that determines the average east-west longitude of the rising or convective branch of the Walker Circulation in the tropical Pacific Ocean (see Figure 4). If the ELI indicates an eastern shift, the El Niño affects global weather patterns much more intensely than a more central Pacific event.
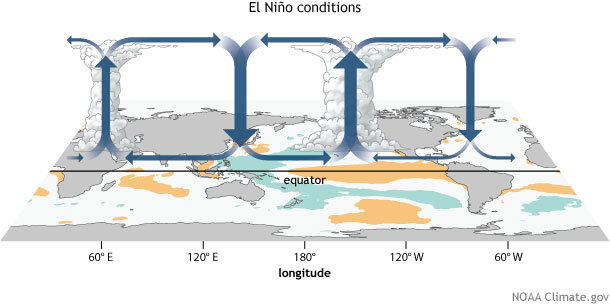
Figure 4: The Walker Circulation pattern, showing a shift of the rising branch toward the eastern Pacific in El Niño conditions.
The ELI for the 2026 El Niño is an easterly record of 191.5°E, versus the previous record of 178.5°E, set by the 1997-1998 El Niño. At the equator, that difference would represent a location nearly 900 miles farther east.
The potential impacts of this record eastern shift are likely to include:
- a stronger Subtropical Jet Stream, intensifying a strong mid-latitude jet stream across the southern U.S.
- a high risk of extreme precipitation events, particularly in California and the Southwestern U.S.
- increased Eastern Pacific Hurricane activity by increasing upper-ocean heat content (More on this later.)
- reduced Atlantic Hurricane activity by atmospheric teleconnections increasing vertical wind shear over the Atlantic basin (Evidence: the very quiet 2026 Atlantic hurricane season!)
These “potential” impacts are beginning to be felt, around the world and closer to home in the Eastern Pacific Ocean.
Global Impacts
The global impact of the developing El Niño is already visible in the current WMO forecasts of temperature and precipitation for the 2026 October – December period. (Figures 5 and 6, below.)
These are “probabilistic” forecasts, that is, they show the likelihood of temperature or precipitation being either above or below the thirty year average for the location. Note that temperatures are measured 2 meters above the surface.
The Temperature probability global forecast is shown in Figure 5. OND signifies the “October-November-December” period.
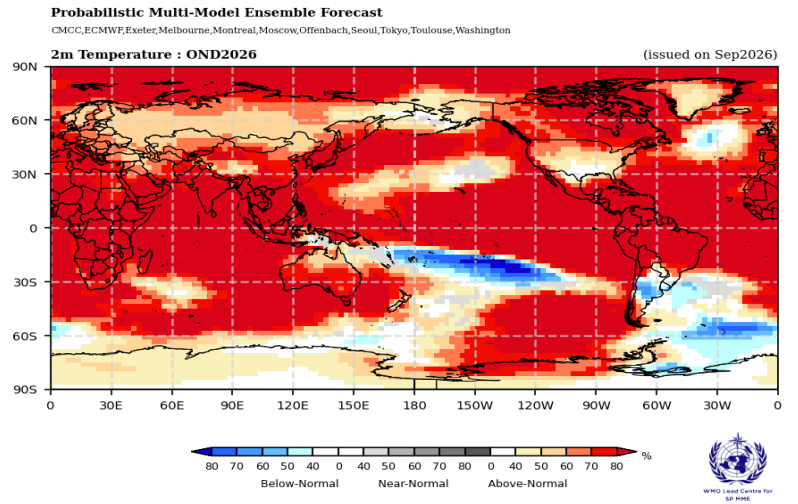
Figure 5: WMO estimated October-December deviation from average temperatures around the world.
The takeaway is that most of the world has a greater than 80% chance of above-normal temperatures for October – December. This will be due in part to global warming and in part to the massive release of ocean heat by El Niño and its impact on global weather. The WMO cautions that “This does not mean every location will be warmer than average every day, but it indicates a strong seasonal signal that raises the likelihood of heat extremes and heat-related impacts.”
Figure 6 shows the likelihood of drier than average or wetter than average precipitation. The forecast shows large shifts in rainfall around the world, consistent with the impact of a strong El Niño.
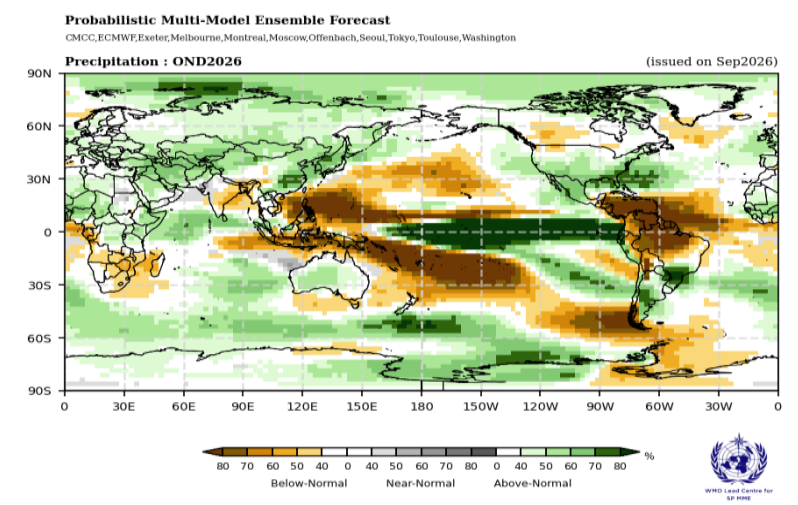
Figure 6: WMO estimated probability of precipitation shifts above or below the average at each location. Above-normal rainfall across the central and eastern equatorial Pacific is consistent with El Niño formation
Overall, the WMO seasonal precipitation pattern closely matches the typical El Niño global precipitation impacts shown in Figure 7 (repeated from an earlier post).
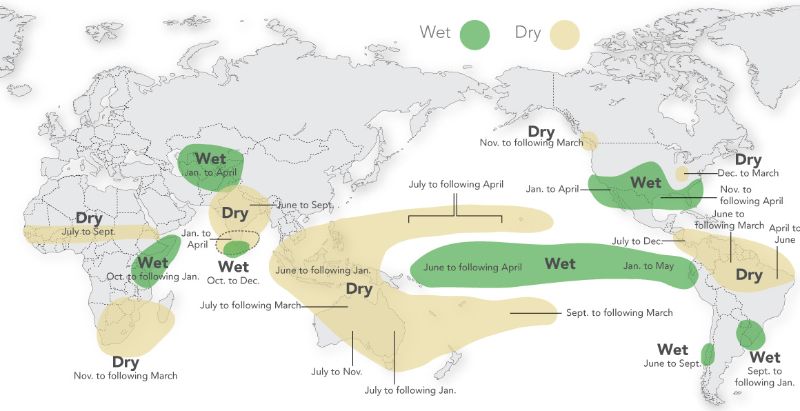
Figure 7: Typical rainfall patterns induced by an El Niño event. Credit: International Research Institute/Columbia University
Global Economic Impacts
Whether or not this El Niño sets a record, its impacts are already being felt around the world. In addition to the physical impacts of a very strong El Niño, there are equally severe economic impacts.
The Peterson Institute for International Economics published an estimate of the global economic impact of the 2026-2027 El Niño, assuming its impact will be equivalent to that of the 1997-1998 super El Niño. The estimate is based on an analysis of 88 countries with known teleconnections to El Niño events and a total GDP of roughly $79.5 trillion. The estimated global economic loss in the year of the event will be approximately $986 billion—roughly 0.8 percent of global GDP. However, the economic impacts don’t end there. Historically, impacts extend for another five years, reflecting “the compounding effect of reduced investment in the years following the initial event.”
The estimated total economic impact over the El Niño year and the subsequent five years is roughly $17.6 trillion.
But we’re getting ahead of ourselves. Let’s get back to the current impacts of this developing El Niño.
Happening Right Now – Eastern Pacific
The clearest weather impact of the 2026 El Niño so far is the very busy 2026 hurricane season in the eastern Pacific. El Niño typically reduces disruptive wind shear over this basin while warm ocean water supplies storms with energy, making intensification more likely and more rapid.
As we mentioned earlier, the 2026-2027 El Niño is the “easternmost” El Niño on record by a wide margin. With that came the anticipated consequences:
- extreme precipitation events in California and the Southwestern U.S.
- increased Eastern Pacific Hurricane activity
- reduced Atlantic Hurricane activity
As of October 18, the eastern Pacific recorded:
- 20 named storms, 6 more than the 1991-2020 average
- 11 hurricanes, 4 more than average
- 9 major hurricanes, 6 more than average
- Accumulated Cyclone Energy roughly 3 times the average
[Note: the official NOAA tabulation omits two major hurricanes, Nolo and Lowell, that reached peak intensity outside the eastern Pacific basin. They are included here.]
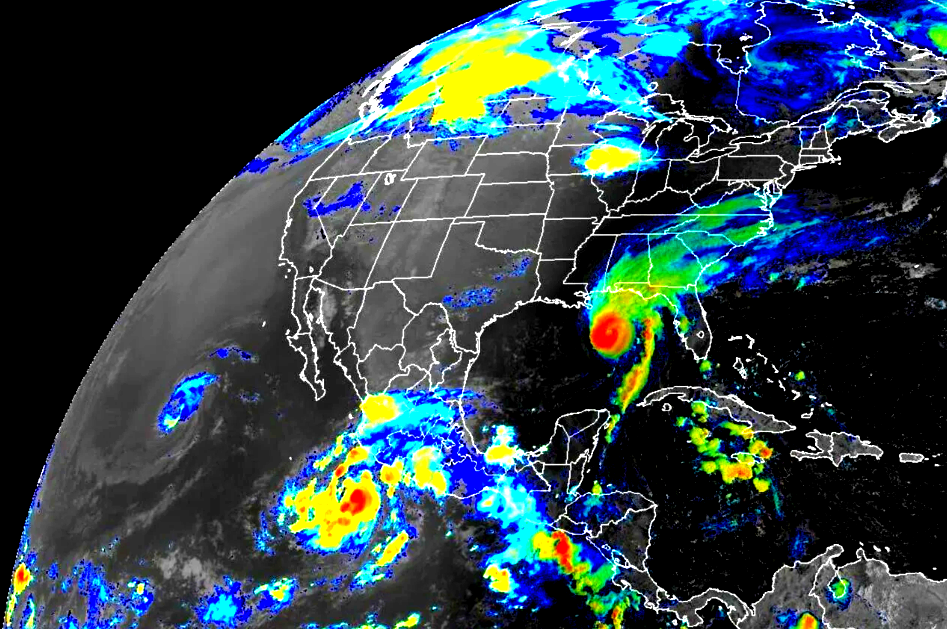
Meanwhile, the Atlantic hurricane season has produced only one hurricane, Hurricane Isaias, which formed in the Gulf and never reached the Atlantic.
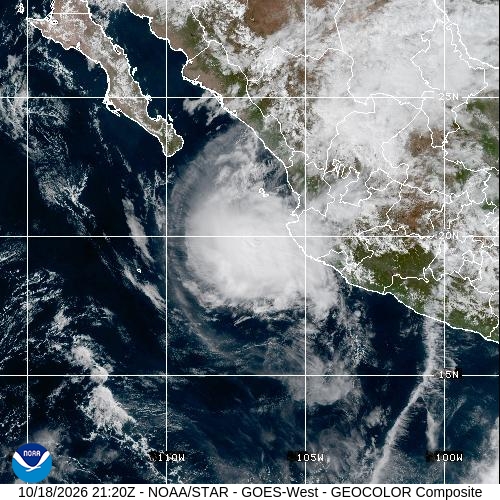
Figure 8: Hurricane Trudy, last on the list – so far. Credit: NOAA/NESDIS/STAR
The season’s effects have also reached the mainland United States. San Diego, California received its first-ever Tropical Storm Alert. Swells from Pacific hurricanes are battering and eroding Southern California beaches and flooding coastal communities, while tropical rainfall has already lashed the Southwest, causing widespread flash flooding.
What’s Next?
We are closely following the El Niño’s development, as well as its developing impacts on the U.S.
The Pacific Ocean is carrying extraordinary heat, the warming atmosphere is carrying record amounts of water, we’ve had a record-breaking hurricane season in the Pacific, and California’s governor has already declared a State of Emergency… Stay tuned!