
With Global Consequences
A Historic Event Is Developing in the Pacific
The ENSO climatological phenomenon described in our May 2026 article, “2026 Is Building Up To A Super El Niño”, is turning into a real barn-burner.
The month of May’s nascent El Niño rapidly strengthened in the tropical Pacific Ocean over the summer months, and government forecasters now say it has better than a 90% chance of becoming a “very strong” event this fall and winter, with a 75% chance of exceeding the strength of every El Niño since 1950. The UK Met Office has gone further, warning that this El Niño is likely to be “the largest since the 19th century.”
As of the September 10, 2026 NOAA update, sea surface temperature anomalies in the eastern equatorial Pacific exceeded +3.0 degrees Celsius, with the Niño-3.4 region (the ENSO benchmark zone) at +2.92°C above average and still climbing.
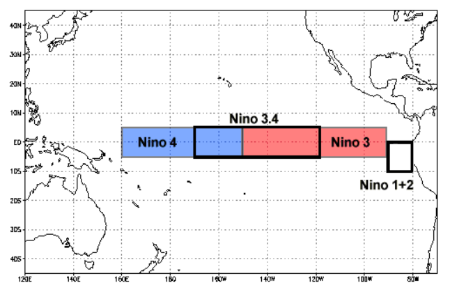
Figure 1: Map showing the locations of ENSO monitoring regions. Credit: NOAA NCEI
The World Meteorological Organization (WMO) has taken the unusual step of declaring, with “exceptionally high likelihood of nearly 100%,” that El Niño will persist through February 2027, prompting UN Secretary-General António Guterres to warn that “the planet is in uncharted waters, and those waters are heating up.”
What Makes an El Niño “Super” — and the New Way It’s Measured
El Niño is the warm phase of a natural phenomenon called the El Niño/Southern Oscillation (ENSO), in which weakening Pacific trade winds allow warm water to spread eastward across the tropical Pacific, releasing stored ocean heat into the atmosphere and reshaping global weather. Traditionally, El Niño strength has been measured by comparing sea surface temperatures in the Niño-3.4 region with a long term average, typically 30 years, to determine the Oceanic Niño Index, or ONI. If the resulting anomaly is positive (warmer), it indicates a potential El Niño. A negative (cooler) anomaly suggests a potential La Niña.
A +0.5°C anomaly is the threshold for an El Niño, +1.5°C a “strong” event and +2.0°C or higher a “very strong” or “super” event. But in a warming world, those benchmarks are a bit misleading. As an example, 2023-2024 showed strong Niño-3.4 readings, but just a muted atmospheric response, because global warming was steadily raising temperatures across the entire tropical ocean basin, making the “long term average” a deceptively cool reference point.
To correct for this, in 2026 NOAA officially adopted the Relative Oceanic Niño Index (or RONI), which subtracts the tropics-wide warming trend from the Niño-3.4 anomaly to isolate the “true” strength of El Niño itself, independent of background climate warming. By the conventional Niño-3.4 index, July 2026 ranked as the warmest month in the 75-year record; by the more conservative RONI measure, it ranked second, behind 1997. Either way, this year’s event is historic, and subsurface ocean heat, the reservoir that fuels further intensification, remained exceptionally strong through late August, with NOAA reporting anomalies exceeding +10°C at depth in the equatorial Pacific.
Evolution of the 2026 El Niño
- Early 2026: La Niña fading – Weak La Niña conditions lingered into January, suppressing global temperatures before ENSO-neutral took hold
- April 2026: El Niño threshold – The Niño-3.4 index crossed the +0.5°C El Niño threshold, in one of the fastest transitions on record
- May-June 2026: Rapid Development – The index reached +1.6°C in June, which suggests a “strong” El Niño. NOAA officially declared an El Niño event.
- July 2026: Record Rate of Development – Niño-3.4 temperatures shot above +2.0°C in early July, the highest rate of intensification on record; the World Meteorological Organization (WMO) warned of more intensification to come.
- August 2026: Reaches “Very Strong” status, but still intensifying – Sea Surface Temperatures exceed +3.0°C over the seasonal average in the Eastern Equatorial Pacific; global temperatures for August tied July 2023 as the hottest August on record at 1.65°C above pre-industrial level.
- September 2026 (this article): WMO issues an El Niño Advisory – “exceptionally high likelihood of nearly 100%” that El Niño will persist through February 2027. The first time we’ve seen such an “unequivocal” WMO forecast.
- November 2026: Predicted Peak – Multi-model forecasts converge on November temperatures reaching 4.0°C in the Niño-3.4 region, crushing the current record of +3.08°C set by the 2015-2016 El Niño in November 2015.
- December through February 2027: Sustained Strength – WMO predicts a near-100% probability that El Niño conditions will persist through February 2027. The climate impacts of this El Niño will continue well beyond that.
How is the El Niño Development Region Warming So Rapidly?
This event has featured exceptionally rapid development powered by one of the largest subsurface ocean heat reservoirs in the observational record, with the result that 91-96% of model runs analyzed by Carbon Brief and independent groups are projecting the strongest El Niño ever measured, surpassing the previous record from 2015-2016. Carbon Brief’s analysis of 667 runs from 14 modelling groups put the median forecast peak at +3.59°C in the raw Niño-3.4 index, with even the more conservative relative index (RONI) pointing to a likely new record. Real-time tracking from Climate Brink, aggregating all major forecast systems, showed Niño-3.4 running at +2.94°C as of September 11, 2026 and forecast to peak near +4°C in November.
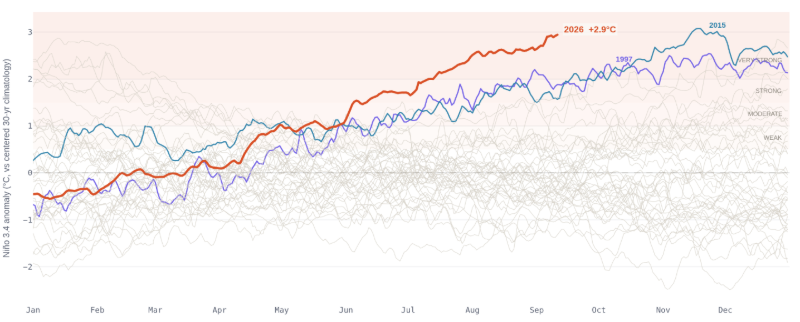
Figure 2: Early, rapid development of heat in the Niño-3.4 zone. Warming is forecast t0 peak in November. Temperatures are already well into the “Very Strong” El Niño category. Temperatures from the two strongest El Niño’s since 1982 – 2015 (green) and 1997 (blue) and 2026 to date (brown). All other years since 1982 are in grey. Credit: Climate Brink
Ocean warming powering this year’s El Niño isn’t limited to the Pacific Ocean, it’s a global trend – driven by human-caused global warming. As we described in a 2025 article, fully 90% of the heat trapped by greenhouse gases is absorbed by the oceans, which has led to a steady increase in global ocean heat content. The annual increase in global ocean heat content in 2025 reached the highest level ever recorded at that time, continuing a nine‑year streak of ever-higher record warmth in the upper 2,000 meters of the ocean.
The Copernicus Marine Service reported that June, July, and August 2026 saw that trend continue, with average sea surface temperatures in the global ocean (60°S–60°N) setting a new record for each month. Summer 2026 yielded the warmest global ocean temperatures on record since 1993, with a global average sea surface temperature of 21.01°C (70°F) in June through August. We can expect the deep ocean to follow suit.
There’s plenty of heat to go around, as we can see in Figure 3, below. The Land-Ocean Temperature Index (L-OTI) Anomaly represents the difference in monthly average surface temperatures when compared to a thirty year average (in this case 1991-2020.) For the month of August, the global average temperature was 0.82°C above the thirty year average. Overall, the map shows that most of the world, land and oceans, was much warmer in August 2026 than the average of previous Augusts. In particular, the map clearly shows the dramatic heat in the Pacific off the coast of Peru – the El Niño formation zone.
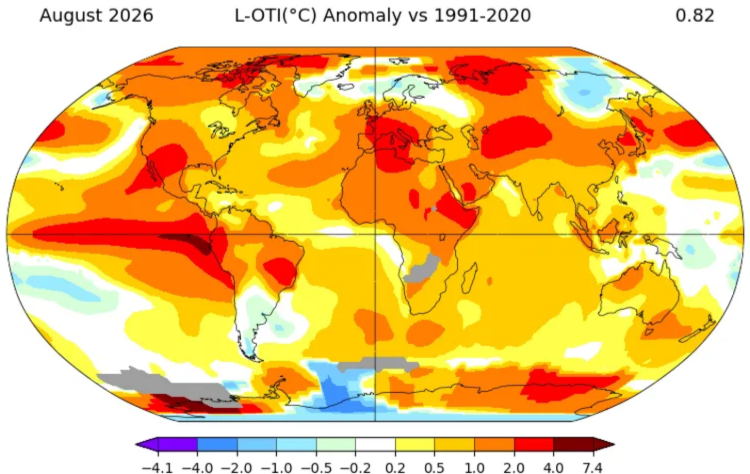
Figure 3: Land-Ocean Temperature Index for August 2026 Credit: @extremetemps.bsky.social/NASA GISS
How Does El Niño Affect Weather Around the World?
The heat in the eastern equatorial Pacific shown in Figure 3 is the key. During an El Niño that heat powers virtually continuous “convective precipitation” over the central and eastern equatorial Pacific. Convective precipitation happens when warm, moist air rises from the sea surface, cools high in the atmosphere, and condenses into massive clouds that produce intense downpours.
Atmospheric Circulation Changes
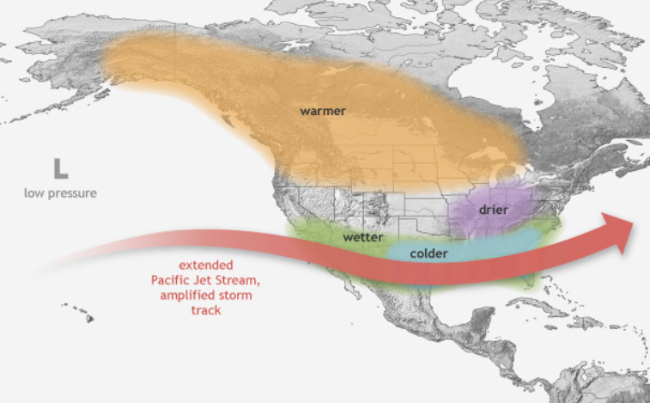
Figure 4: Typical winter weather pattern over North America during an El Niñ0 year. Credit: NOAA
Another example of the impact of El Niño on “normal” weather patterns is the virtually non-existent 2026 Atlantic hurricane season. The early and unusually rapid onset of El Niño led to a trifecta of unfavorable conditions for hurricane formation: extreme wind shear (strong upper level winds); dry air and Saharan dust; and persistent high pressure over the western Atlantic, inhibiting development of convective circulation. Conversely, tropical cyclone activity in the very warm eastern and central Pacific basins has been off the charts – nearly double normal levels.
Teleconnections
Teleconnections are the significant relationships or links between weather phenomena at widely separated locations on earth, which typically entail climate patterns that span thousands of miles. As an example, by strengthening the upper atmosphere circulation, El Niño can trigger a cascade of noticeable departures from normal rainfall patterns around the globe. The changes in the atmospheric circulation and subsequent ground-level climate impacts, that stretch across the globe are called El Niño teleconnections.
Figure 5 shows what changes to rainfall patterns, and during which seasons, El Niño teleconnections can create across the globe. However, teleconnections are not an on/off switch. These impacts are likely during an El Niño, but they are not guaranteed. However, the stronger the El Niño, the more likely the teleconnection effects become.
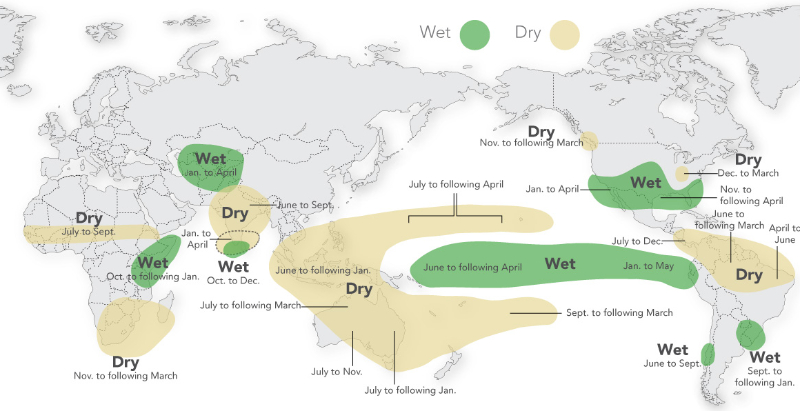 Figure 5: El Niño conditions in the tropical Pacific can change rainfall patterns thousands of miles away. Credit: International Research Institute/Columbia University
Global Impacts: A “Danger Zone” of Extreme Weather
The WMO’s September update was unusually blunt in its language, warning the world has entered “the danger zone of extreme weather,” with El Niño’s fingerprint already visible in droughts and floods across multiple continents even before the event peaks. Specific regional risks now flagged by WMO and NOAA include drought stress across the Greater Horn of Africa, Indonesia, the Philippines, Australia and parts of Central America, alongside flood risk in coastal South America, southern Brazil, East Africa and the southern United States. The UN’s own blunt assessment, with El Niño being “supersized before our eyes,” in Secretary-General Guterres’ words, reflects the fact that WMO has never before issued such an unequivocal ENSO update in its 50-year history.
So far, the emerging effects of the 2026-2027 El Niño resemble the effects of other strong El Niño events (see Figure 5.)
- Drought conditions in Central America are obstructing vessel traffic in the Panama Canal, which uses freshwater to fill the locks for each ship. Rainfall in May through August was roughly 34% below the seasonal norm.
- Tens of thousands of small scale farmers in Guatemala, Honduras and El Salvador have lost crops.
- An ongoing drought in the Caribbean has intensified, leading to water-rationing in Puerto Rico.
- Hot, dry conditions in Indonesia have resulted in an early, above-average start to wildfire season. A previous Strong El Niño in 2015 fueled catastrophic fires, which burned roughly 2.6 million hectares
- India had below-average monsoon rainfall, despite flooding elsewhere in the country
- Dry weather in Southern and East Africa is threatening food security. The UN World Food Program projects that tens of millions of people in these regions will suffer acute food insecurity
In other parts of the globe El Niño is delivering too much rainfall:
- Heavy rain and snow in Chile and Peru have caused flooding and disrupted mining operations
- The Horn of Africa is predicted to see a repeat of the heavy flooding that occurred during the 2023 El Niño, displacing millions of people
The UN warned in early August that the conditions created by El Niño could push 50 million people into acute hunger by the end of 2027.
The Biggest Story May Be 2027, Not 2026
Global temperatures typically lag the tropical Pacific peak by three to six months, so the largest warming boost from this El Niño will likely appear in 2027 rather than 2026 – mirroring the pattern seen after 1997-1998, 2015-2016 and 2023-2024, when the following year, not the El Niño year, set the temperature record. Carbon Brief’s estimate puts 2026 around the current record of 1.51°C above preindustrial levels but projects 2027 at approximately 1.71°C — which would “comfortably set a new record” with a 92% chance of doing so. The UK Met Office also predicts it is “very likely” 2027 will be the hottest year ever recorded globally. More recent estimates for 2026 by Climate Brink peg 2026 at 1.63°C above preindustrial, suggesting that 2027 may be even hotter than we expect.
Nothing is Certain…
Even with unusually strong model agreement on the broad trajectory, meaningful uncertainty remains. Peak magnitude estimates still vary: NOAA’s official discussion cites a 75% chance of exceeding the 1950-2026 record, while some model ensembles (Climate Brink, Met Office) point toward monthly anomalies approaching 3.9-4.0°C, which would be dramatically larger than any documented event. Regional impacts remain probabilistic rather than certain – NOAA stresses that a historic El Niño raises the odds of textbook regional effects without guaranteeing them anywhere specific. Finally, whether 2026 or 2027 ultimately claims the “warmest year” title may hinge on which temperature dataset is used, since Carbon Brief’s analysis shows the odds of a 2026 record range from 66% in NASA and Berkeley Earth data down to just 9-13% in the ERA5 and JRA-3Q reanalyses – a repeat of the dataset-dependent disputes seen after the 2015-16 super El Niño.