
Energy Sources
Modern economies are prodigous consumers of energy. Our consumption of all forms of energy has grown exponentially since the beginning of industrialization in the 19th century. This has contributed to rising standards of living, increasing life expectancy and diminishing poverty. Unfortunately, using all that energy has had some unwanted consequences, one of which is climate warming.
In the lead-up to COP26, the first major status review of the Paris Agreement by its signatories, attention is focused on how we use energy going forward and how application of that energy is linked to greenhouse gas emissions. In our end-to-end energy utilization system, energy is classified as primary, final, or “useful.” “Primary energy” refers to energy as it is found in nature – crude oil, for example. “Final energy” is what we actually use – think gasoline derived from crude oil. We can go one step further and define “useful energy” as the fraction of that final energy gasoline that actually moves your car.
The efficiency with which a primary energy source is converted to final energy and ultimately to useful energy is key. Refining crude oil to gasoline has an efficiency of roughly 85%. The car’s internal combustion (aka controlled explosion) engine loses 80% of that energy in the form of heat and vibration, leaving only 20% of the energy for actually moving the car. The result: in this example only 17% of the primary energy was actually “useful.” Similarly, a typical coal-fired power plant converts primary energy (coal) to final energy (electricity) with an efficiency of only 33%. Unfortunately, in the combustion process the carbon in coal, or any other fossil fuel, very efficiently combines with oxygen in the air to produce CO2.
The following chart clearly shows the dominance of fossil fuels – coal, oil and gas – as primary energy sources. A quick glance at the chart would suggest that renewable sources of energy are insignificant in comparison to fossil fuels and in no position to meet most of our energy needs. However, according to BloombergNEF, even though fossil fuels make up 80% of primary energy consumption, because of the inefficiency of the combustion process they generate only 60% of the world’s useful energy. On the flip side, 20% of global primary energy demand is being met by non-fossil sources, and that 20% provides 40% of the world’s useful energy.
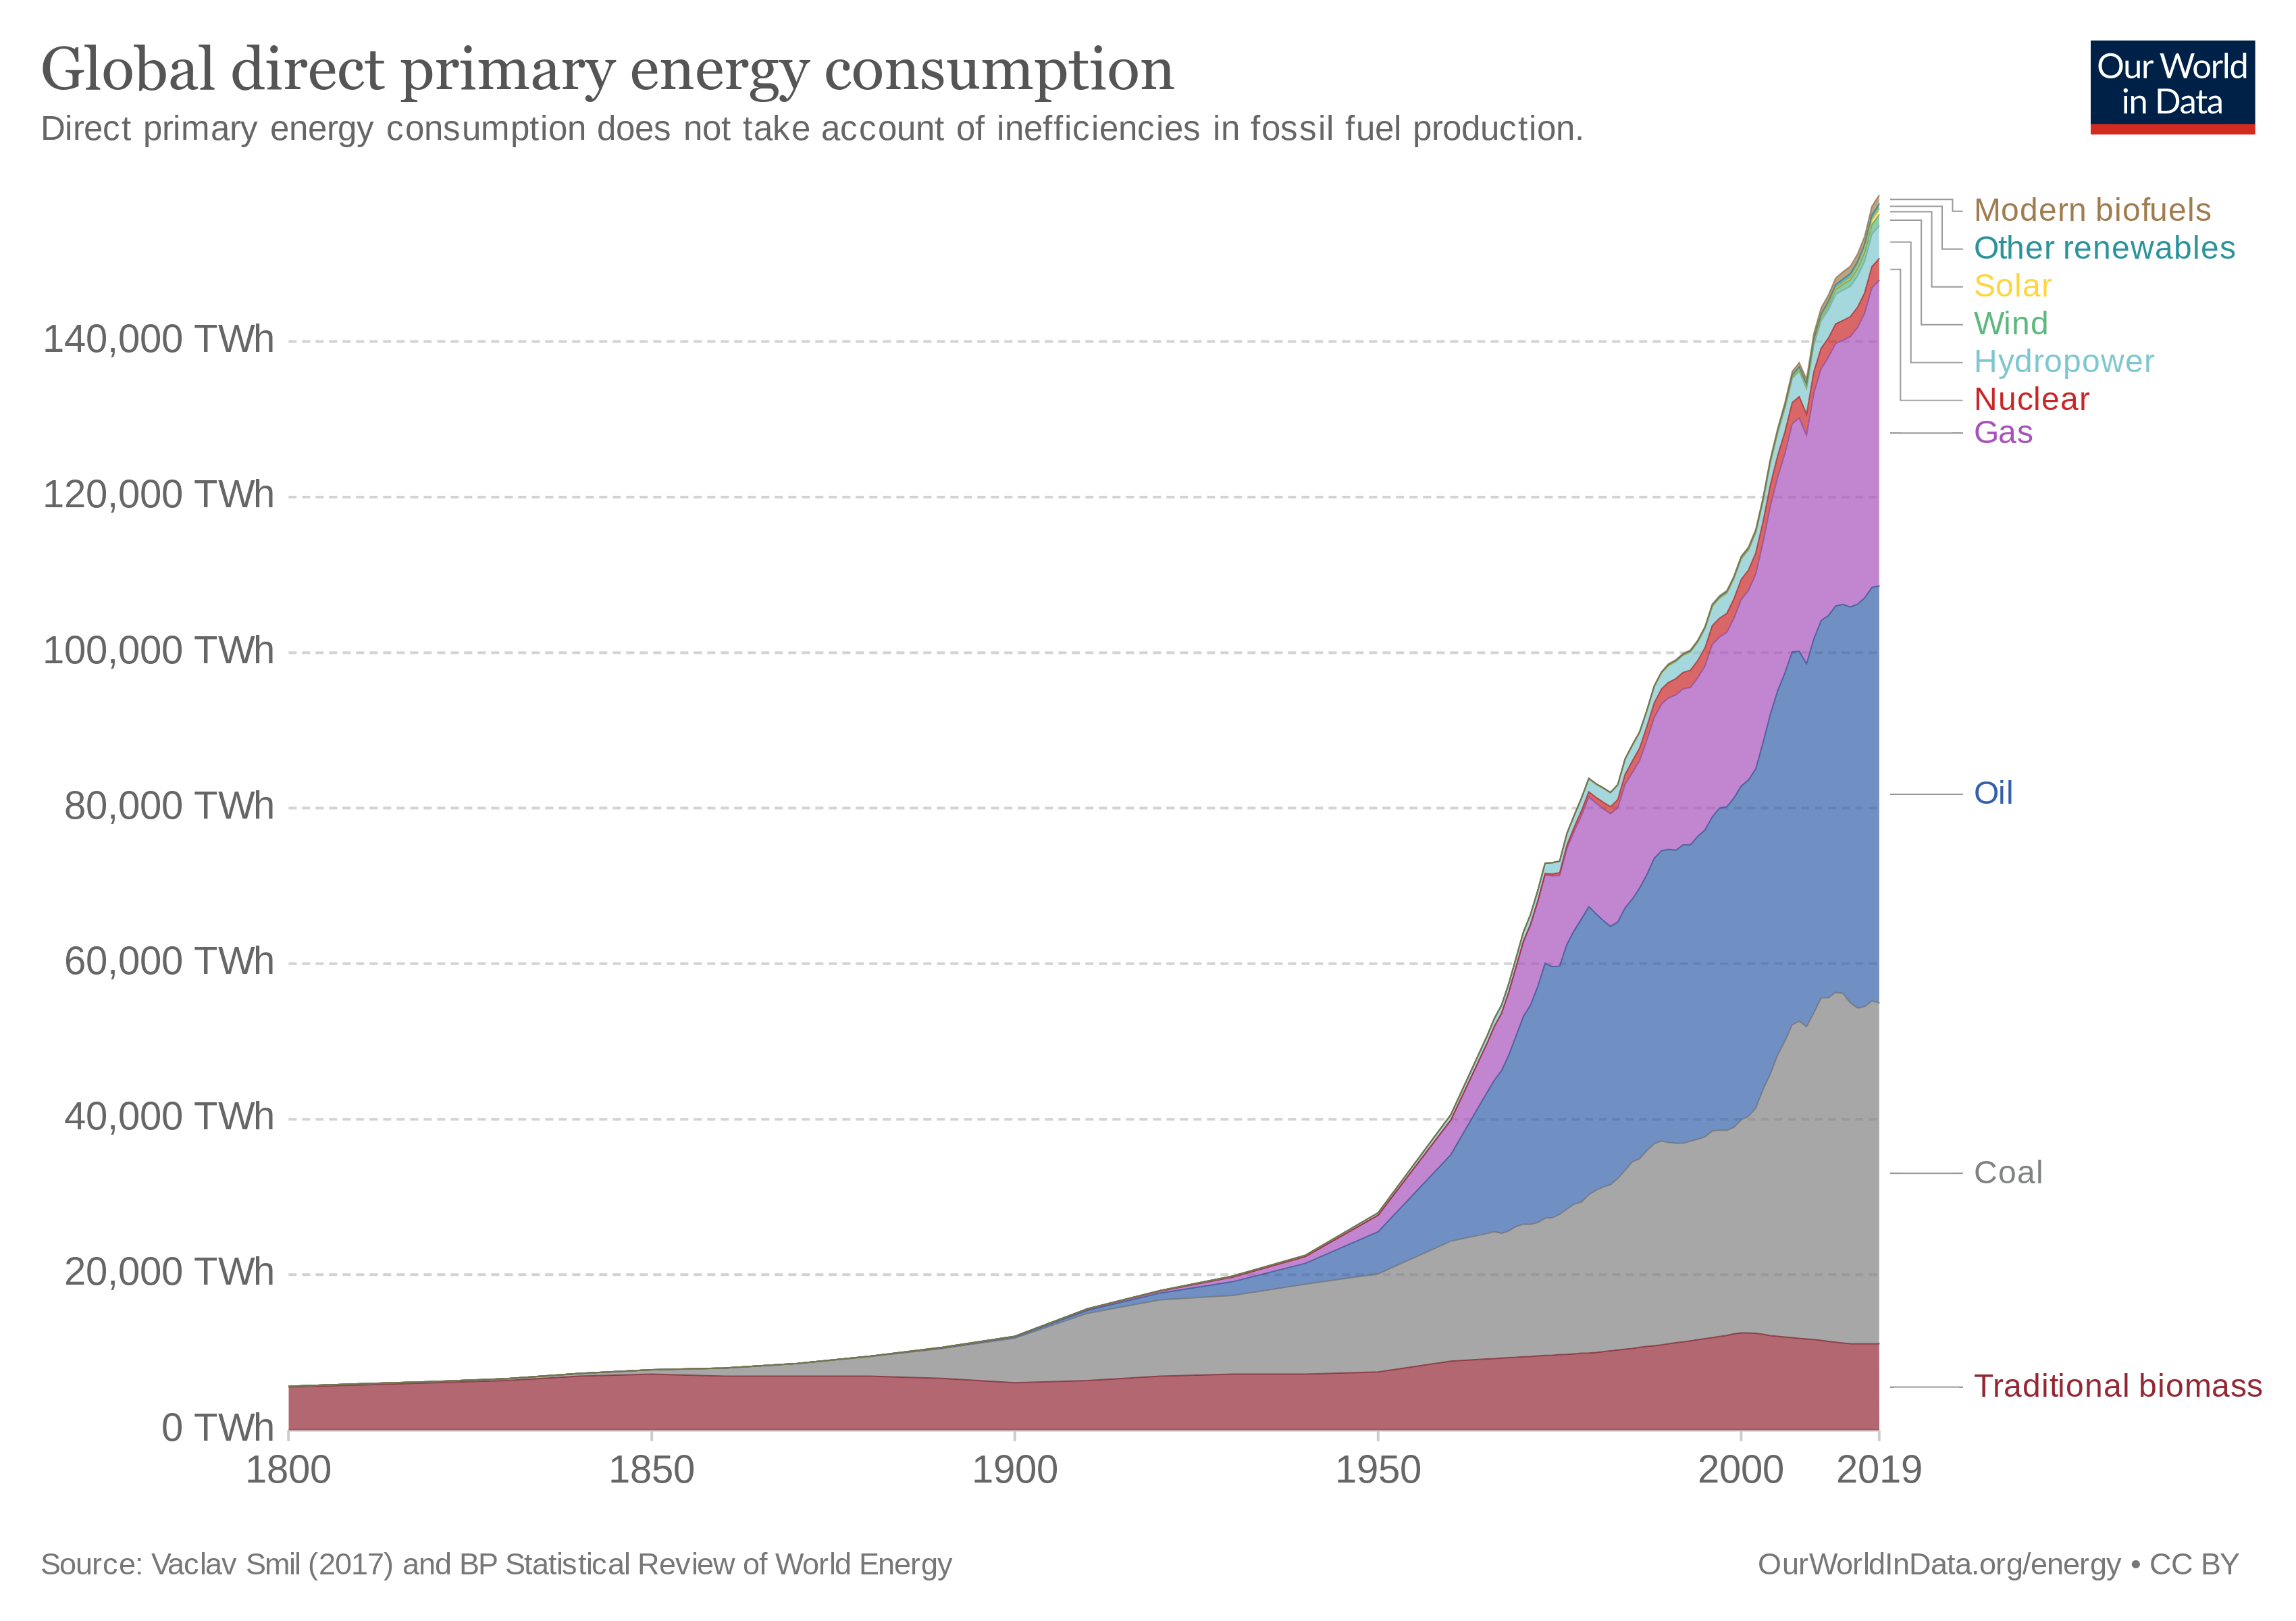
Global primary energy consumption through 2019. All energy use is converted to TeraWatt-hour (TWh) equivalents for comparison. Source: Our World in Data (CC.BY)
One of the best sources of information related to trends in worldwide production and use of energy is the International Energy Agency (IEA). Based in Paris, the IEA is an autonomous intergovernmental organization operating within the framework of the OECD. Created in the wake of the 1973 oil crisis, its focus has since broadened from the international oil market to cover the entire global energy system, from fossil fuels to renewables. Much of the data in this post is derived from its recently released “Global Energy Report 2021.”
Energy Use and CO2 Emissions
As the chart above shows, the consumption of carbon-based fossil fuels has grown exponentially in less than 200 years. Burning all that fossil fuel has released massive quantities of CO2, a potent and long-lived greenhouse gas, into the atmosphere. The result is shown in the graph below. Over 800,000 years, CO2 levels averaged less than 225 ppm and never exceeeded 300 ppm. Today, atmospheric CO2 concentration is well over 400 ppm and steadily rising.
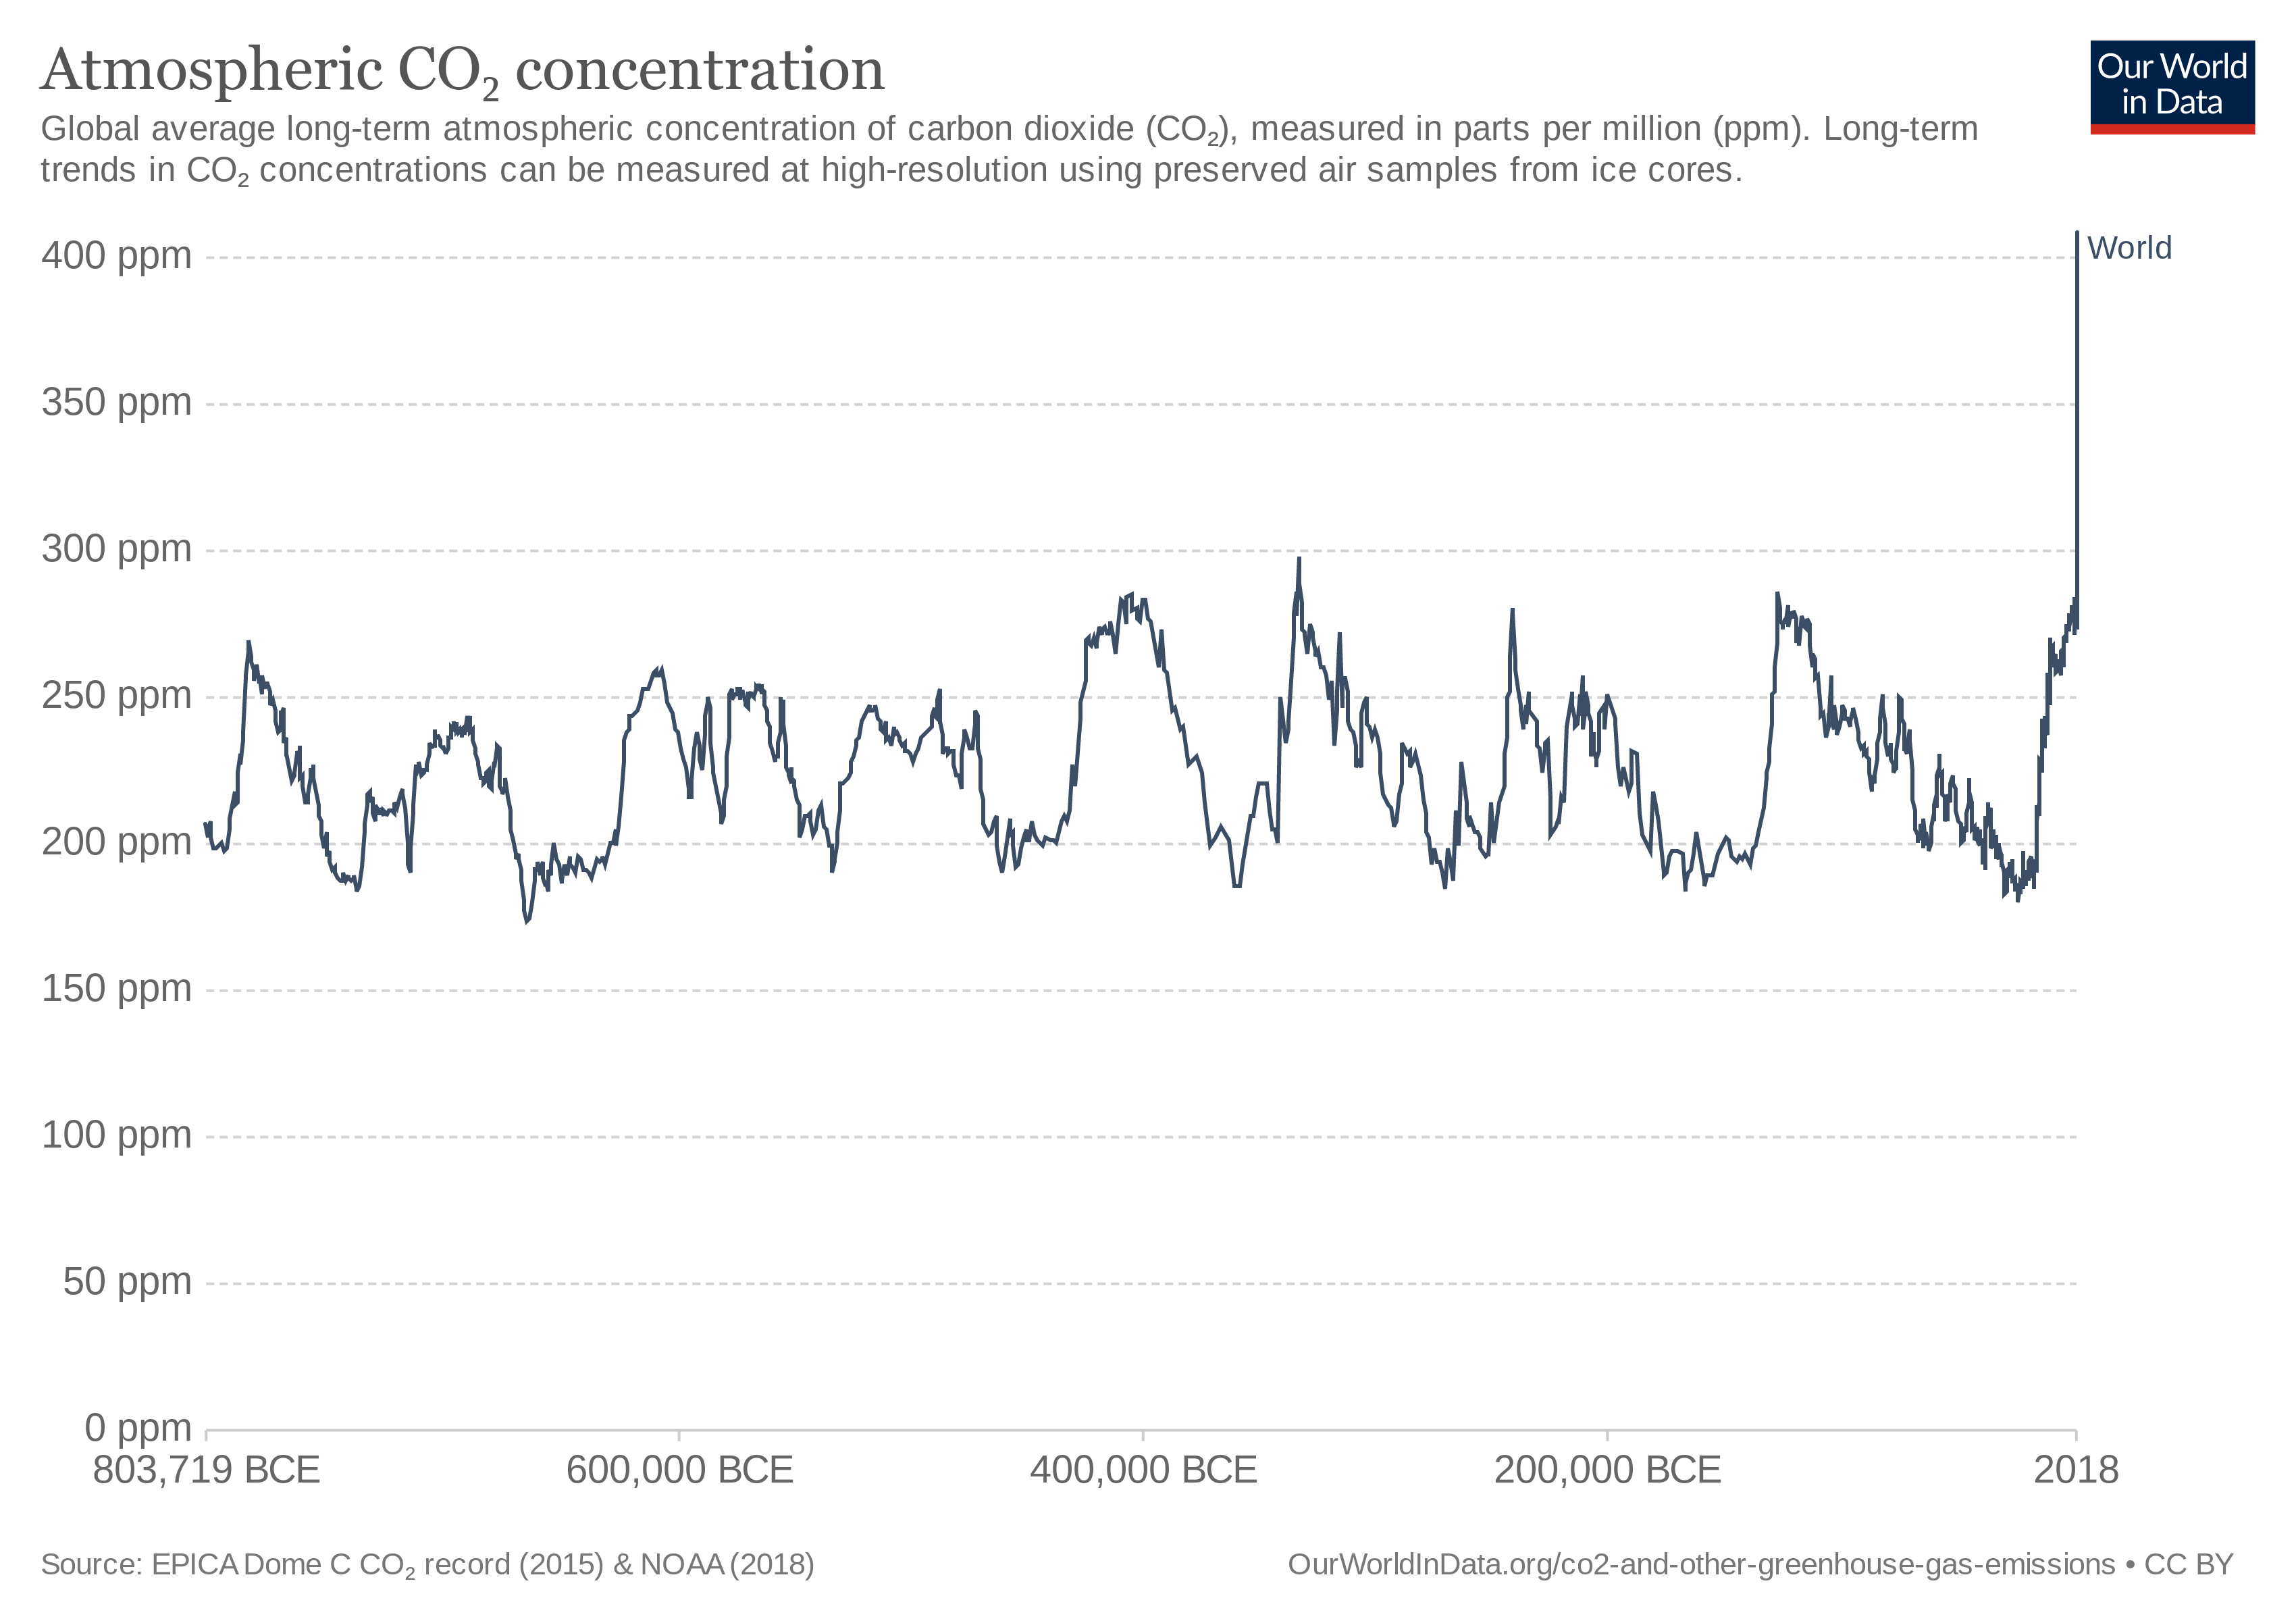
Current levels of CO2 are unprecedented in the last 800,000 years. Source: Our World in Data (CC.BY)
Our energy discussion focuses on CO2 because it represents more than 75% of all manmade greenhouse gas emissions. Energy production of all types contributes roughly 70% of manmade GHG emissions. Before we can discuss how to address the problem, we need to look at the components of energy use-related CO2 emissions. The following graph breaks down annual global CO2 emissions by source type.

Annual CO2 emissions by source type. (Note: 1 billion t = 1 Gt) Source: Our World in Data (CC.BY)
Global CO2 emissions peaked at 33 Gt in 2019, then fell by nearly 2 Gt in 2020 as energy demand for coal and oil fell during the peak of the pandemic. In 2021, IEA projects global energy related CO2 emissions to rebound by nearly 5% to nearly 2019 levels.
Of the three fossil fuels, oil is responding slowest to the economic recovery from the pandemic, with CO2 emissions from road transport, domestic aviation and international aviation consequently projected to remain well below 2019 levels.
Coal-related emissions are expected to exceed 2019 levels in 2021 and approach the 2014 record, accounting for 44% of global CO2 emissions. The power sector will account for 80% of the increase from 2020 levels, largely driven by increasing coal-fired electricity generation in Asia.
CO2 emissions from natural gas combustion will blow through 2019 levels to set a new record of 7.35 Gt — 22% of global CO2 emissions. Natural gas use in buildings and industry is largely responsible for the rapid rebound from 2020.
A regional breakdown of CO2 emissions adds more depth to the challenge of reducing CO2 emissions globally.
Overall, CO2 emissions from advanced economies are in a structural decline, forecast to remain below 2019 levels despite their economic recovery from the COVID pandemic. IEA estimates that their emissions have decreased by 1.8 Gt since 2000, and their share of global emissions has dropped by 20 percentage points to less than a third of the global total.
Emerging markets and developing economies now account for more than two-thirds of global CO2 emissions, led by China and India. In both cases, the driver is coal-fired electricity generation. In China, 2021 CO2 emissions from fossil fuels are forecast by the IEA to be nearly 0.6 Gt above 20219 levels, with coal contributing 70% of the increase. China’s coal-fired power plants account for fully one-third of global coal consumption.
Energy Use in a Net-Zero world
Let’s assume that COP26 reaffirms a global commitment to stop climate warming. The climate will keep warming until we stop adding CO2 to the atmosphere — when we reach Net-Zero. As a rough rule of thumb, in order to limit warming to the Paris Agreement goal of “well below 2ºC,” we need to reach net-zero by 2060. If we wish to meet the Paris Agreement “aspirational goal” of 1.5ºC, we need to achieve our goal by 2040 (see this post for more details.) Judging by the IEA 2021 report, we’d better get moving!
In order, China, the US, India, the EU and the Russian Federation are the largest CO2 emitters. China has recently suggested that it will reach net-zero by 2060. The EU, and recently the US, have committed to reach net-zero by 2050. So everyone’s intentions are good, but can we do it?
In a previous post, we reviewed an exhaustive Princeton University strategic planning exercise that showed a number of pathways for the US to reach Net-Zero by 2050. Reducing the use of fossil fuels to a minimum is the long pole in the Net-Zero tent. (They won’t be eliminated entirely. There are no viable alternatives for aviation and maritime shipping, for example.) A cost-effective carbon capture and storage solution will be required to augment natural carbon sequestration methods and take care of residual CO2 emissions. Other issues, such as agricultural practices and land use will have to be addressed, but they pale to insignificance next to the fossil fuel problem. The first key, for any country, will be replacing fossil fuels with renewables as primary energy sources going forward.
The second key is extensive electrification of final energy. With the exception of biofuels, renewable energy sources generate electricity as their final energy product. This means transport solutions powered by electricity, or by hydrogen generated by electrolysis (“green” hydrogen), or by biofuels. It means heat pumps for building heating and cooling, and all-electric residential appliances. The good news is that all these solutions already exist at scale. The Princeton study goes into a great deal of detail about final energy use in a heavily electrified economy.
All this change isn’t as daunting as it may seem. As BloombergNEF points out, renewables already produce 40% of the world’s useful energy, so we’re well on the way.
Renewable Energy Trends
The primary energy sources for renewables include wind, sun, water (for hydroelectric power), nuclear fission, and bioenergy. Wind and solar energy are free, ubiquitous, and eternal. Fossil fuels are not.
IEA reports that global electricity generation from renewable sources grew nearly 7% in 2020, while total renewable energy use grew 3% as demand for all other fuels declined. As a result, renewables provided 29% of global electricity generation in 2020. Continuing the trend, renewable electricity generation is forecast to expand more than 8% — growing for the 20th consecutive year. China will account for nearly half of the global increase, followed by the US, the EU and India.
Implications
All of this growth in renewables has been powered by a modicum of political foresight, turbocharged by the rapid price reduction for both solar PV and wind generation, averaging 18% per year and 9% per year respectively over the last decade.
This is all very encouraging news as we try to plot a course to a net-zero future, but without a coordinated global strategy (looking at you, COP26) it is difficult to see how we can reach global net-zero by 2060, much less 2040 for the 1.5ºC target. Moreover, to the casual observer or conservative policy-maker, incremental increases in electrification (notably for transportation) and renewable electricity generation, no matter how promising, look like baby steps when what they think we need are giant strides. But it looks like they are having trouble seeing the forest for the trees.
Fortunately, financial analysts are very good at solving this sort of “can’t see the forest for the trees” problem. Analysts look at this problem through the lens of the “Levelized Cost of Energy” (or Electricity) — an economic measure used to compare the lifetime costs of generating electricity across various generation technologies. That brief definition doesn’t do justice to the financial complexities of the LCOE calculation. Suffice it to say that the LCOE is the gold standard tool used by policymakers for long-term planning. BloombergNEF reports that the global average LCOE for new utility-scale solar PV installations fell below $30/MegaWatt-hour in early 2020 and predicted that by 2o30 the average will be below $20/MWh. Plummeting costs mean that new-build utility-scale solar and onshore wind are the cheapest options in much of the world, putting existing coal and gas power plants at risk.
Meanwhile, financial think tank Carbon Tracker Initiative released a report titled “The Sky’s the Limit” in April, 2021, exploring the implications of the continued rapid decline in the cost of renewable electricity generation. In that report Carbon Tracker predicts that “at the current growth rates of solar and wind, fossil fuels will be pushed out of the electricity sector by the mid-2030s.” Another report by IHS Markit predicts the LCOE of onshore wind and solar PV in South Asia to decrease between 40-65% by 2050. They further point out that utility-scale solar PV was already the cheapest source of electricity in India by 2020, with wind expected to be the second least expensive by 2024.

A Princess phone, circa 1960
We have all experienced the technology acceleration curve of mobile phones. If renewable generation technologies are on an iPhone-like technology acceleration curve, then it looks like fossil fuel power plants are destined to be tomorrow’s Princess phone. The Sky’s the Limit, indeed.