
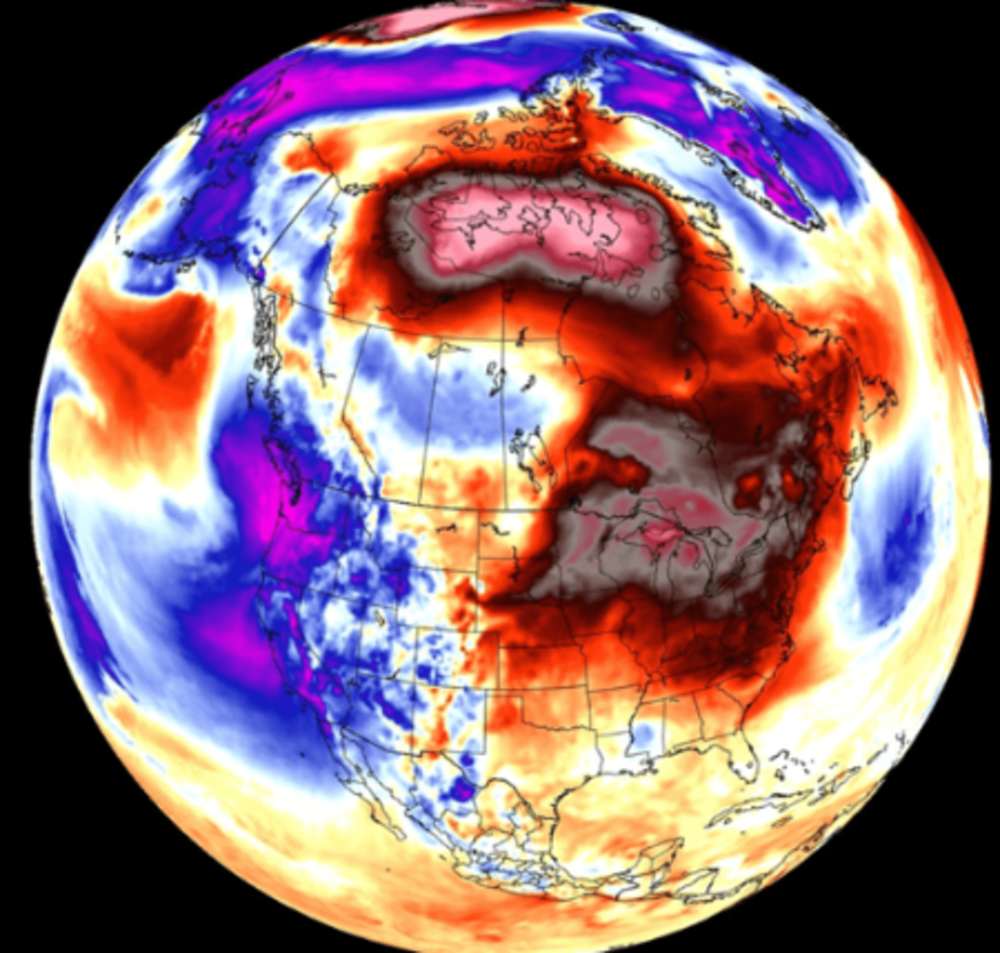
The Changing Climate Yields Record Heatwaves
Part 1 of this article covered four months of chaos caused by extreme heatwaves in 2026. By the fifth consecutive month (July 2026) the chaos worsened, as repeated heatwaves ravaged Europe and the U.S., accompanied by massive wildfires in already tinder-dry forests and grasslands on both continents.
In Part 2 we consider the genesis of extreme heatwaves, evaluate the influence of climate change on the 2026 events, and finally, we take a look at what’s ahead.
Regular CAC readers and supporters may recall this closing statement from an article we published in 2022:
Regardless, the consensus is that future heatwaves will be more frequent and more intense. This is not just a long term problem — we can count on steady, significant changes in the behavior of heatwaves from now through 2050.
Unfortunately, it looks like we were right.
How Extreme Heatwaves Happen
In the mid-latitudes of the Northern Hemisphere conditions favorable to development of the extreme heatwaves described in Part 1 occur as a consequence of the behavior of jet streams in the atmosphere. It turns out that the direct and indirect effects of climate warming on the jet stream play a starring role in changing the frequency, duration and intensity of extreme heatwaves. Let’s see how this works…
The Origin of Jet Streams
Differences in temperature across the earth’s surface and in the atmosphere create differences in air pressure, and air moves from high to low pressure. The larger the temperature difference between two locations, the stronger the wind. Jet streams are high-altitude, planet-encircling, relatively narrow bands of very strong wind, flowing from west to east, typically around 30,000 feet above ground level.
The major jet streams form at the boundaries between the tropical, temperate and polar air masses, where contrasts in temperature are greatest (Figure 1).
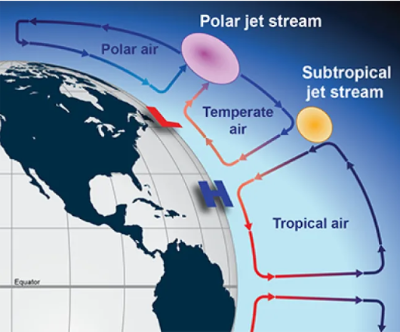
Figure 1: A cross-section of atmospheric circulation from the equator to the pole. Credit: NOAA
The Polar Jet
There are several different jet streams, but the strongest is the polar jet. The polar jet is located between the 50°and 60° latitudes, riding the steep temperature difference between cold polar air and warm mid-latitude air. The result is a strong system of eastward-flowing winds that can move at speeds in excess of 200 mph, keeping the cold air confined to northern latitudes.
A jet stream doesn’t follow a fixed path as it moves from west to east around the globe. Instead, it meanders to the north and south while rising and falling, sometimes splitting, as shown in the mesmerizing NASA animation below.
Figure 2: Animation of the Northern Hemisphere polar jet. Colors represent the speed of the wind ranging from slowest (light blue) to fastest (dark red) Credit: NASA Scientific Visualization Studio
Approaching North America from the west, the polar jet stream moves northward over the Rocky Mountains, then dips southward forming a trough toward the East Coast, then northward as a ridge over the Atlantic Ocean. It continues in a similar long wave pattern over Europe, Asia, and the Pacific. Storms develop and track along the jet stream, pushing cold air south and warm air north. Low-pressure systems develop in the troughs, high-pressure systems in the ridges.
Jet Streams and Heatwaves
Heatwaves in the mid-latitude summer typically occur under a slow-moving high-pressure weather system following the jet stream. Clear skies in the high-pressure system allow the strong summer sun to heat both the surface and the air above it. The heated air expands and rises, only to be trapped and forced back down by high pressure in the upper atmosphere. The air is compressed as it’s forced downward, which makes it even warmer. This re-circulation process drives the extreme heat within the resulting “heat dome.” Passing clouds are deflected away from the dome, and the weather within the dome remains sunny, dry and progressively hotter.
Figure 3. Heat Dome circulation Credit:Royal Meteorological Society
Heatwaves typically last just a few days before the high pressure system moves eastward. However, a meteorological process called “blocking” can park a high-pressure system over the same region for weeks on end. In this situation, the region under the dome experiences an extended period of clear skies and no rain. This dries out the ground and, once the soil moisture is gone, all of the sun’s energy goes into warming the surface and temperatures soar.
Blocking weather patterns can occur in a “wavy” jet stream when waves in the jet stream become amplified or break. This tends to slow the west-to-east progression of weather systems, making conditions more persistent and opening the door for blocks to form.
The Blocking High
Typically a summertime occurrence, blocking high pressure systems are responsible for major heat waves.
An example is the “Omega block”, so-called because its shape in the jet stream resembles the uppercase letter Omega (Ω) in the Greek alphabet. In this configuration, alternating areas of high and low pressure form in the peaks and troughs of the waves in the jet stream, as shown in Figure 4 below.
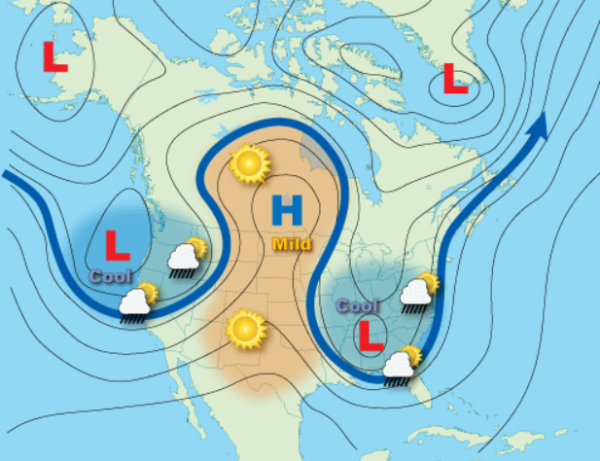
Figure 4: An “Omega Block.” In this example, a combination of two cutoff lows with the blocking high between them. Credit: NOAA
The block interrupts the prevailing flow of westerly winds, which could otherwise break up the heat event with cooler, more “normal” conditions. The block creates the potential for ever more extreme conditions to develop. In the summer of 2010, for example, an Omega block left a high-pressure system parked over western Russia for much of July and August. The resulting heatwave saw most of western Russia record its hottest summer in history.
Recently, persistent Omega blocks in 2026 fueled the March heatwave in the U.S. Southwest, the Independence Day heatwave in the Northeastern U.S., and the June and July heatwaves in Europe.
But why were 2026 heatwaves so severe? We need look no further than climate warming.
The Role of Climate Change
Climate change does not cause heatwaves directly. As we’ve shown, heatwaves are a straightforward product of stationary high-pressure weather systems. But climate change can affect heatwaves in two ways: by making heatwaves hotter and more intense or by making those weather systems more frequent and/or longer-lasting.
Making Heatwaves Hotter
Individual heatwaves are the result of weather patterns like the Omega block, but they are built on the foundation of a rapidly warming world. 2026 is currently on track to set an annual average surface temperature of 1.58°C above the pre-industrial average. June 2026 was the second warmest global June on record, with over 24 countries setting national records.
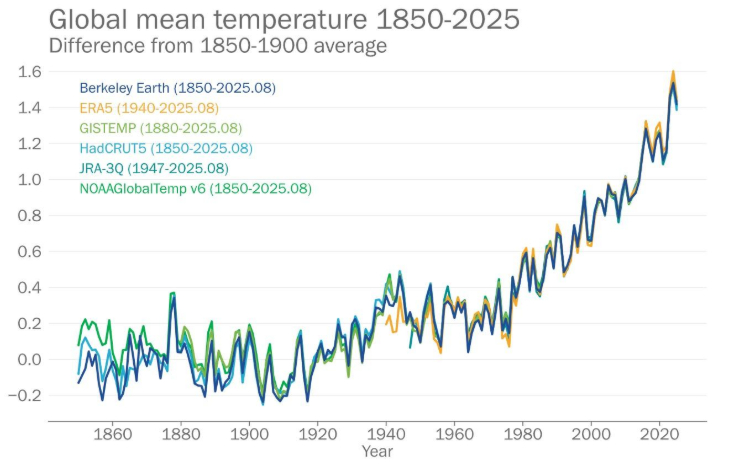
Figure 5: Graph of global average annual temperature since 1850 Credit: WMO
The late June 2026 extreme heatwave centered in France is a case in point. Bordeaux recorded its hottest day in more than a century of measurement. Hundreds of stations passed 40°C, and many exceeded 44°C. In Bordeaux, June maximum temperatures have risen by nearly 6°C over the past 50 years. Across Western Europe, the warmest summer days have warmed by about 3.2°C (5.8°F) in the same period — faster than summer averages have risen, as shown in Figure 6. The worst days are getting worse.
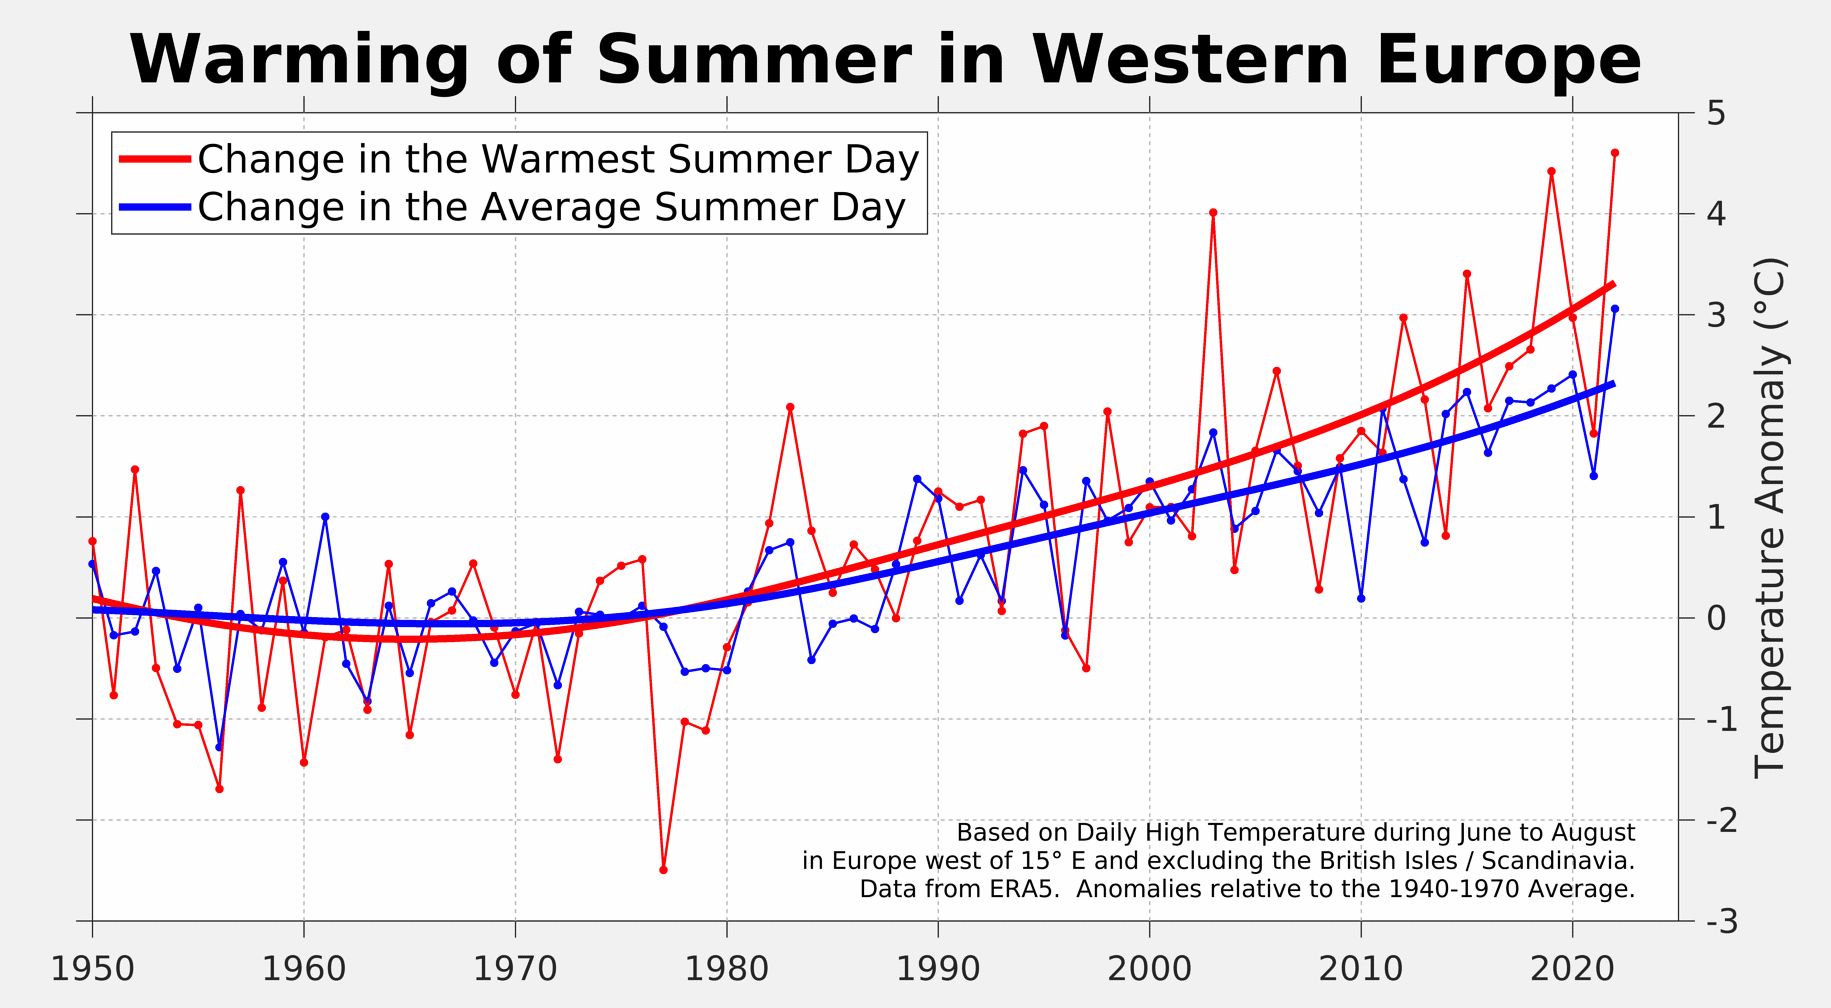
Figure 6: In Western Europe the hottest summer days are warming nearly a degree faster than the monthly average temperatures. Credit: Zeke Hausfather/Berkeley Earth
Overall, Europe has been warming at a much faster rate than the world as a whole: roughly twice as fast as the global average, and 40% faster than the global land average. In a sense, Europe may be the proverbial canary in a coal mine for other regions. And this is a global problem, as shown in Figure 7 below.
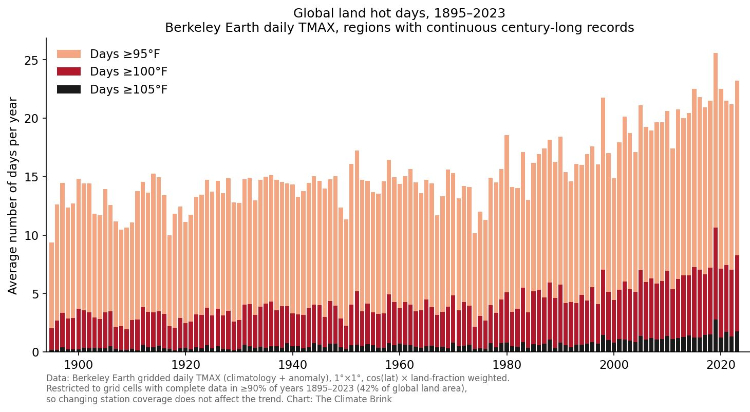
Figure 7: The average number of very hot days has accelerated since the late 1970’s
Although these temperature changes are dramatic, short term changes of a few degrees may not seem that serious. Unfortunately, heat impacts are non-linear, because biological, social, and infrastructure systems operate with critical thresholds, physiological tipping points, and compounding feedback loops (Dessler, 2023). Instead of damage increasing at a steady rate with every extra degree, consequences can escalate rapidly once specific limits are crossed.
Analyzing the June 2026 heatwave, the international science consortium at World Weather Attribution (WWA) determined that the meteorological conditions (an Omega block) were broadly similar to previous summer heat events – troublesome but nothing unusual. “However, a similar circulation pattern now produces significantly hotter temperatures than it did in the mid-20th century because the climate baseline has warmed” (WWA Scientific Report – European Heatwave) [pdf].
The WWA report goes on to conclude: “This summer shows that at 1.4°C of global warming, extreme heat is already reaching the limits of our societies’ ability to cope. Our analysis here shows that intense heat is increasing rapidly even in living memory, with such events tens to hundreds of times more likely since only 2003 and virtually impossible just 50 years ago.”
Changing the Behavior of the Jet Stream
Every heat wave described in this article—on both sides of the Atlantic, in every month from March through July—was sustained by the same underlying mechanism: a weakened, meandering jet stream that allows high-pressure systems to stall in place for days or weeks. The polar jet stream is powered by the temperature contrast between the Arctic and the temperate mid-latitudes. Because the Arctic is warming 2 to 4 times faster than the rest of the planet (a phenomenon called Arctic amplification) that contrast is shrinking, and the jet stream is slowing and more frequently meandering into the exaggerated, wave-like patterns that can allow high pressure systems to build into the heat domes that plagued Europe and the U.S. in the summer of 2026.
Researchers at NASA’s Goddard Space Flight Center confirmed that heatwaves like this have become measurably more frequent in the United States in recent decades. In fact, summer heat waves in the U.S. roughly doubled in number between 1980 and 2023, increasing from an average of two to four per month.
Arctic Amplification
Global warming has had the unexpected effect of warming the Arctic two to four times faster than the global average, a phenomenon called Arctic Amplification. As the bright, reflective snow and sea ice melts, exposing the darker ocean water to incoming solar radiation, local warming accelerates in a positive feedback loop.
At the same time, water vapor is transferring from the warm mid-latitude oceans to the Arctic. When warm moist air is carried to the Arctic, it can lead to more low-lying clouds that act like a blanket, trapping warmth near the surface. The poleward movement of heat and moisture contribute to Arctic’s sea-ice retreat and low-cloud formation, amplifying Arctic warming.
A third element of Arctic Amplification is “positive lapse rate feedback.” The cold, stable Arctic air mass is being warmed from below, whether from solar energy absorbed by newly exposed ocean, or by heat and moisture transfer from lower latitudes. The result is surface air warming much faster than the upper atmosphere, which reduces the loss of heat radiation to space.
Effects of Arctic amplification
As global warming enhances polar amplification, the mid-latitude jet stream intensity is suppressed. The confluence of these effects leads to wavier jet streams.
Scientists have observed that the reduced temperature difference between the North Pole and tropics is associated with slower west-to-east jet stream movement and a greater north-south dip in its path. This pattern causes storms to stall and intensify, rather than move away as they normally used to. At the mid-latitudes (e.g., the U.S. and Europe), more extreme weather results from this new pattern, including droughts, floods, cold spells, and heat waves.
What’s Ahead?
This leaves us wondering if the last few months were just a flash in the pan — a rogue summer, if you will. If that’s not the case, if 2026 is metaphorically telling us “You ain’t seen nothing yet,” then what does the future look like?
There’s More To Come
As we move into August, while Europe fights record-setting forest fires — the aftermath of June and July’s heat waves — yet another heat wave seems to be in our immediate future in the U.S.
The forecast chart in Figure 8 shows the anticipated weather pattern for July 31, 2026. The slow moving high pressure system is spawning another massive heat wave in the Southwestern U.S. which should migrate slowly eastward.
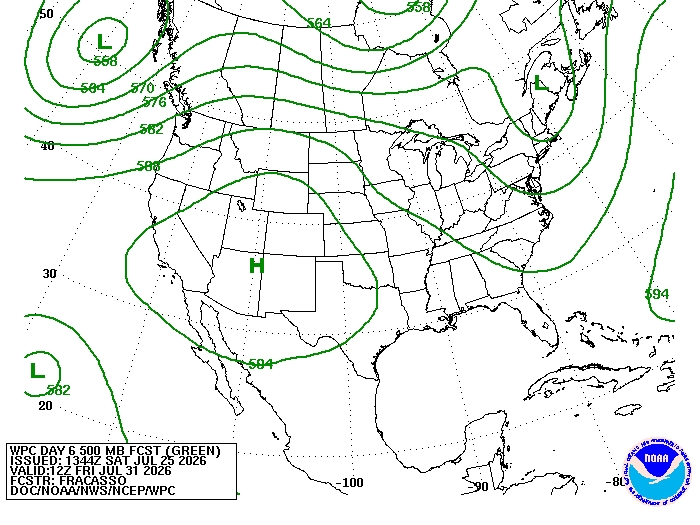
Figure 8: July 31 forecast chart for the U.S. – perfectly set up for another heat dome.
Figure 9 shows the accompanying temperature forecast. Dozens of record highs will likely fall in at least 12 states in the West, with nearly 50 million people under heat alerts. Not surprisingly, July 2026 is in the running for the hottest July on record.
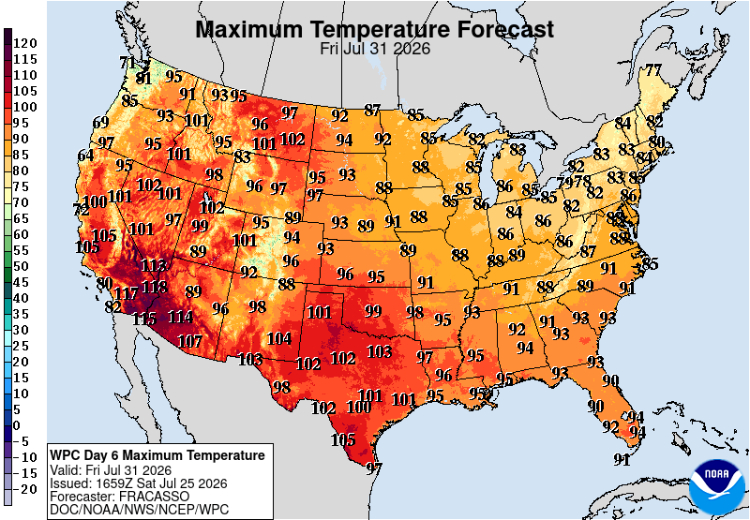
Figure 9: Forecast maximum temperatures as of July 31, 2026.
At this writing (August 2, 2026), Las Vegas has recorded a high of 46°C (115°F), 10°F above normal. El Centro, California, may hit a record 118°F (48°C).
The Big Picture
Based on the extremely strong El Niño that is building in the Pacific, global temperature projections predict that 2026 is on track for an average of 1.58°C +/-0.07°C above the pre-industrial average. This would make 2026 the second hottest year on record, just behind 2024. There is even a 30% chance that 2026 could turn out to be the hottest year.
If you’d like to follow along as the year develops, this data is provided by the Climate Dashboard and updated daily.
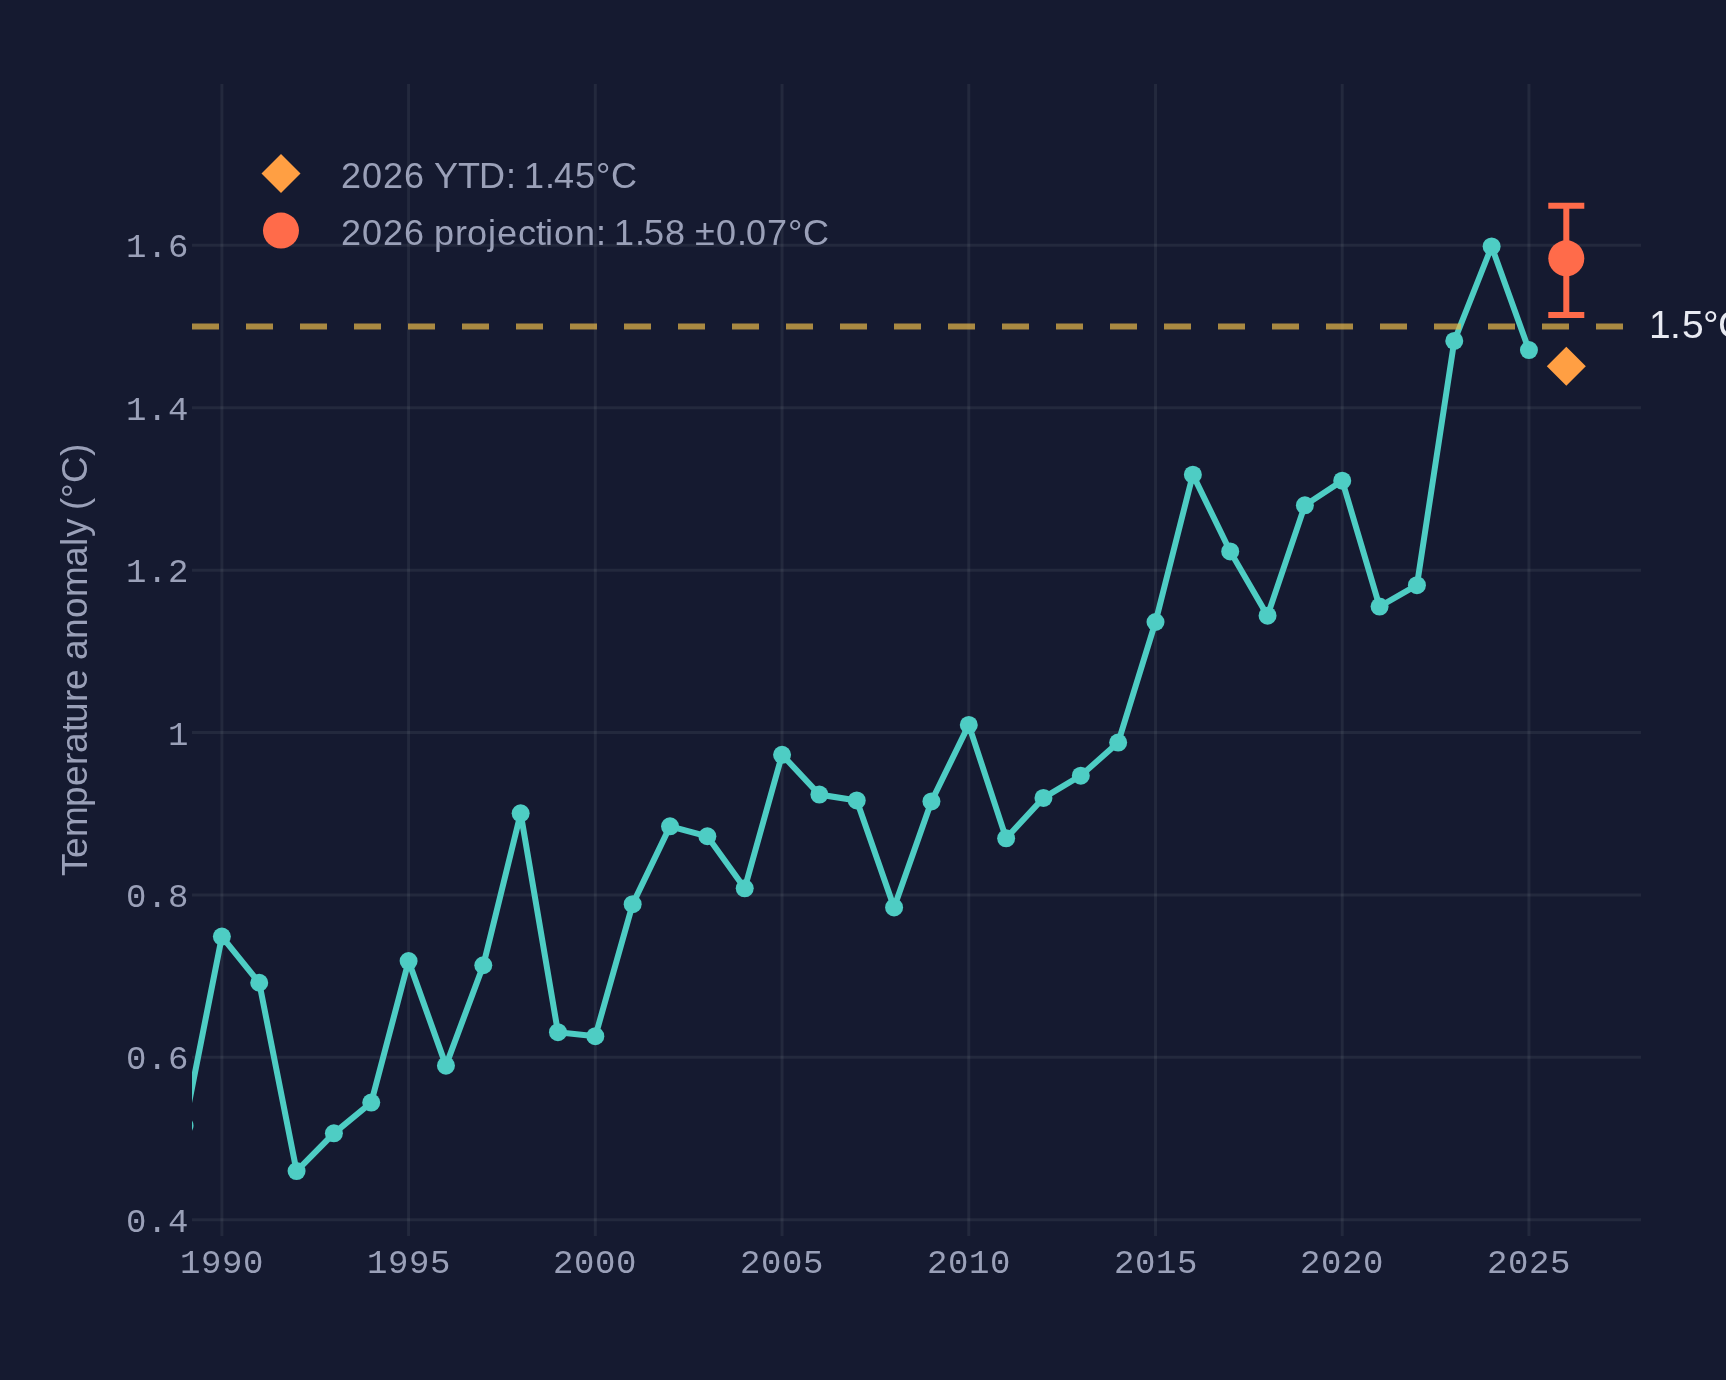
Figure 10: As of July 31, 2026, the year is on track to end up the second warmest year on record.
And no, the developing El Niño is not the cause of this year’s heatwaves. That said, 2027 should be very interesting, to say the least.